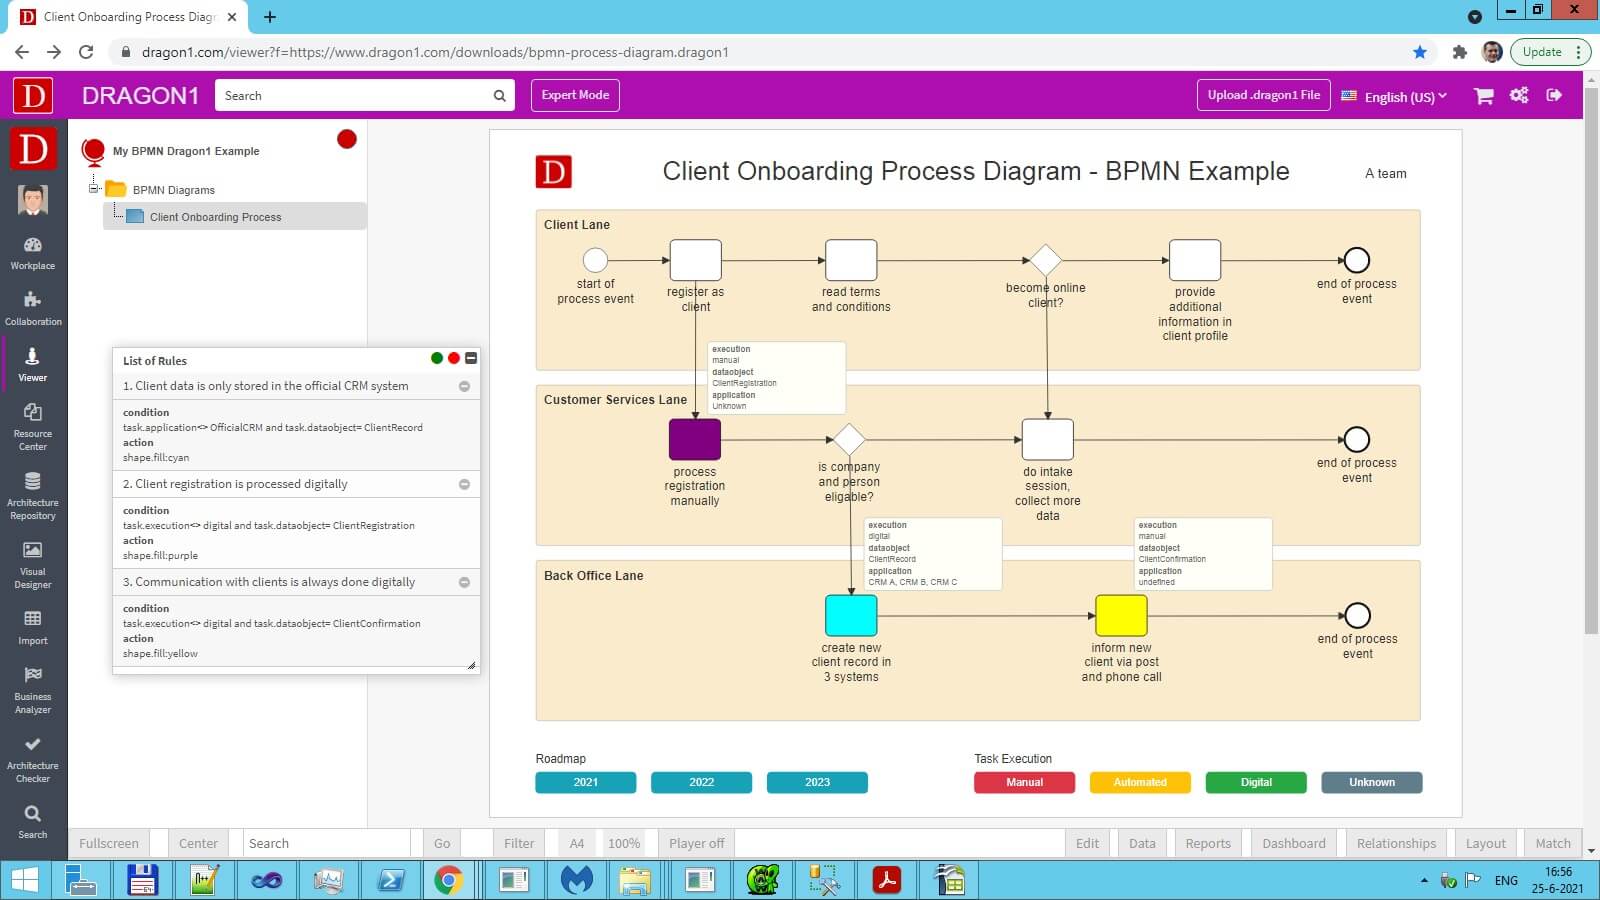
This BPMN Process Diagram Demo shows you the following:
- A BPMN process diagram flow diagram is perfect for analyzing and improving business process flows.
- A BPMN process diagram flow consists of lanes per actor, and in every lane, you see events, tasks, and gateways.
- Dragon1 makes generating a BPMN process flow diagram and a process catalog easy, using an Excel sheet or a .dragon1 File (JSON) as input.
- Also, it is easy to generate a RACI matrix from a BPMN process flow diagram.
- The Viewer makes it easy to measure and improve the quality of a business process with rules, principles, and standards.
- This is very helpful when innovating or transforming business processes.
- The Dragon1 demo steps at the right show some features of the Viewer.
This demo lets you easily generate your BPMN process flow diagrams using the template. The result is a map with tasks. It shows elements of a process organized in lanes.
Example BPMN Process Diagram
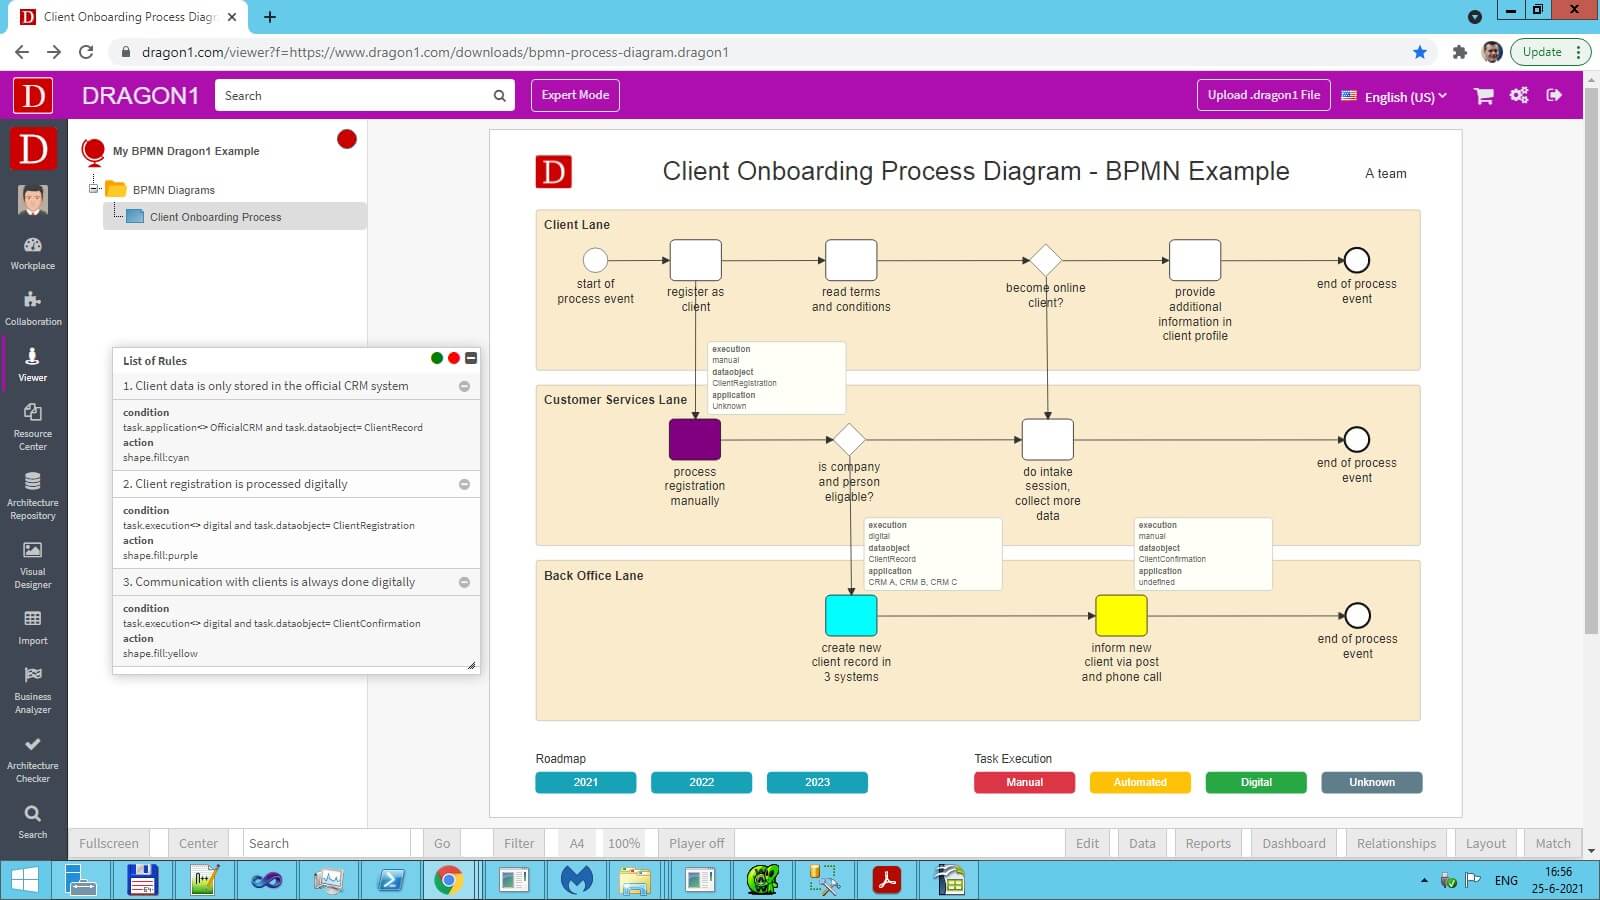
The visualization below shows the diagram that is generated in real-time in the Viewer.
This is done by populating a built-in visualization template with the data from the Excel sheet or .dragon1 File.
A visualization template is a set of areas with an X, Y position, width, height, and color. Every area is configured to receive certain entity classes and position them in a certain layout.
The user can edit a visualization template, and new ones can also be created and stored in the repository.
In this way, Dragon1 gives you a lot of visualization, design, and analysis freedom as a user.
BPMN Editor
Use the specialized editor for the BPMN diagram on Dragon1.

Specialized editor for BPMN diagrams.
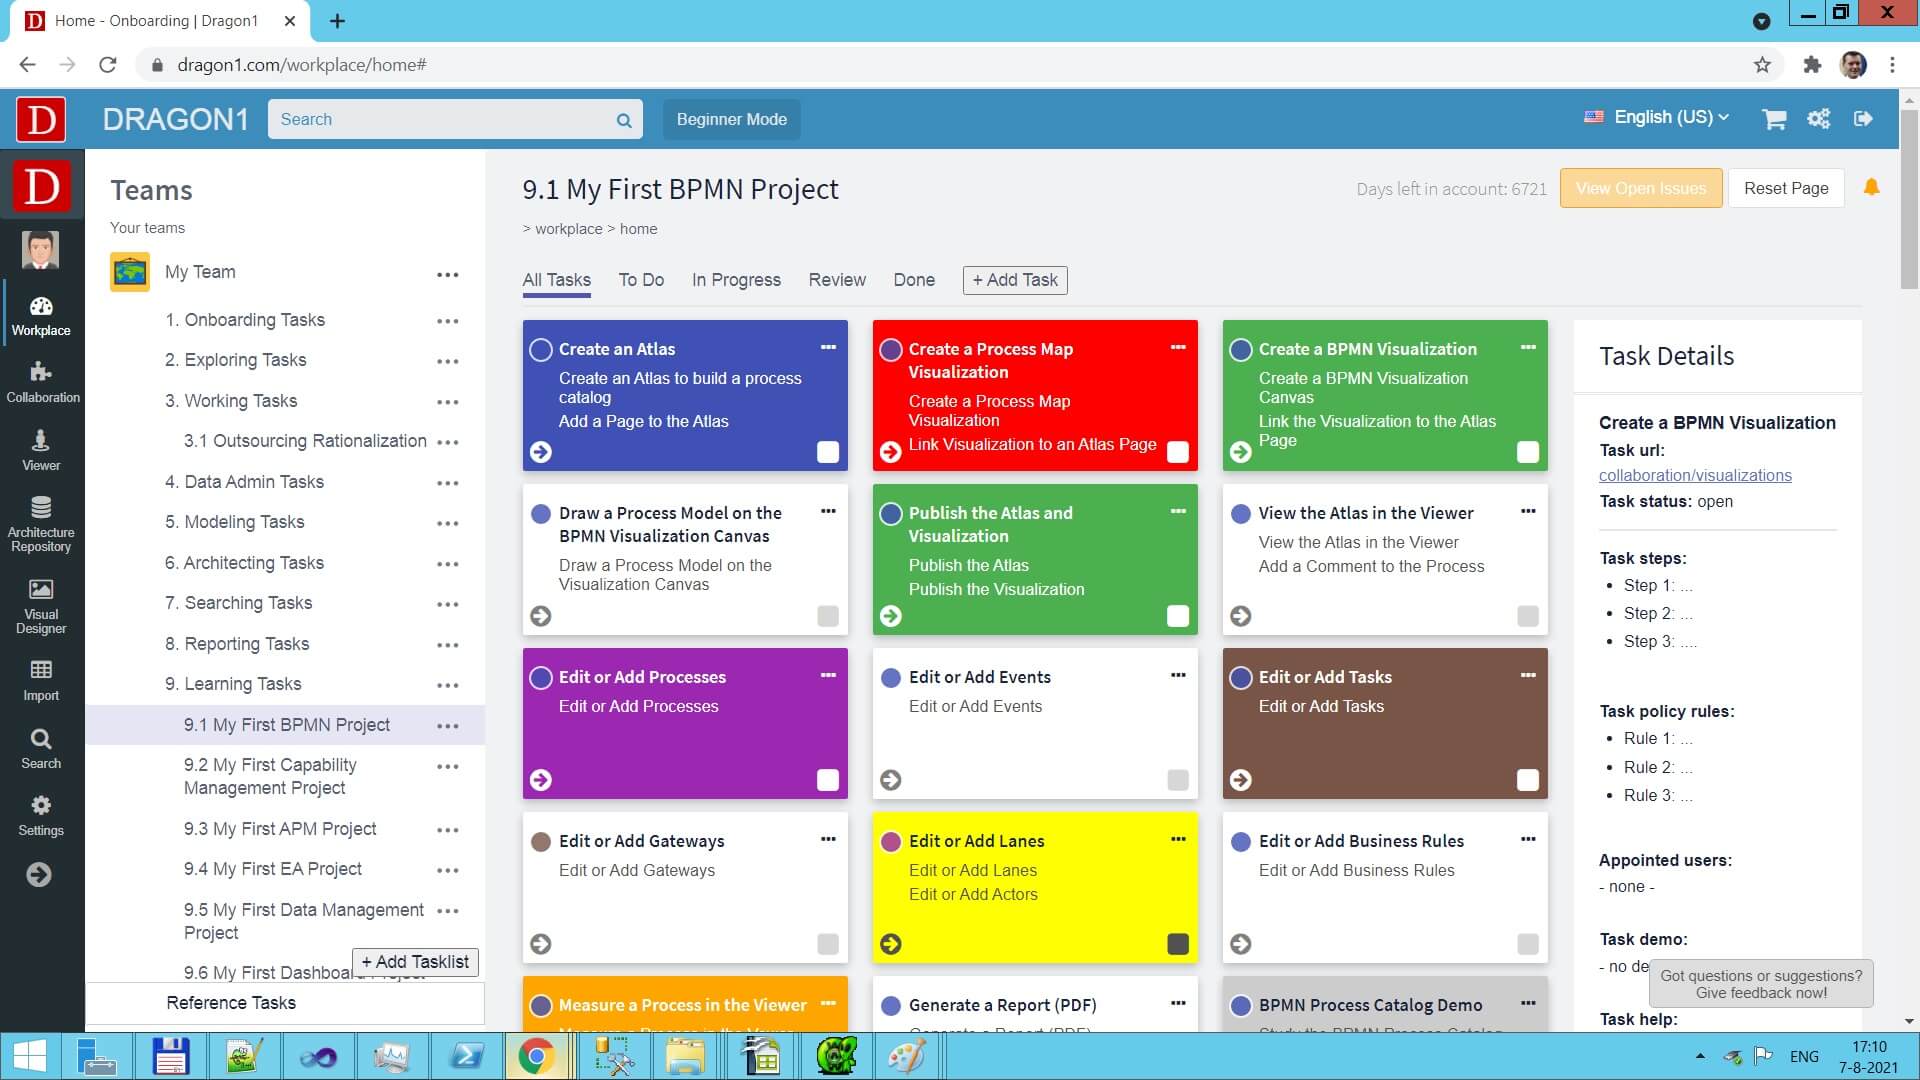
Using the Workplace TaskBoard
Users who log in are presented with a task board.
The learning curve is not steep on Dragon1. Why?
This is because of the TaskBoard. You can edit the preconfigured task lists, and next follow the steps and create effective content.
NO VENDOR LOCK-IN
Did you know Dragon1 does not create a vendor lock-in?
This is done via the .dragon1 file format.
The example above is downloaded/exported and generated/imported using a .dragon1 file.
Why Create a Free Trial Account?
Want to skip converting an Excel sheet to JSON and upload the Excel sheet directly in the Viewer? Or do you want to store data in the Dragon1 repository? Create a trial account!
If you want to (re)use your company data professionally, you can upload the data to your paid user account. Go to the Online Store to purchase your Dragon1 PRO user license. If you would like to purchase paid user accounts for your team, don't hesitate to contact sales@dragon1.com.


