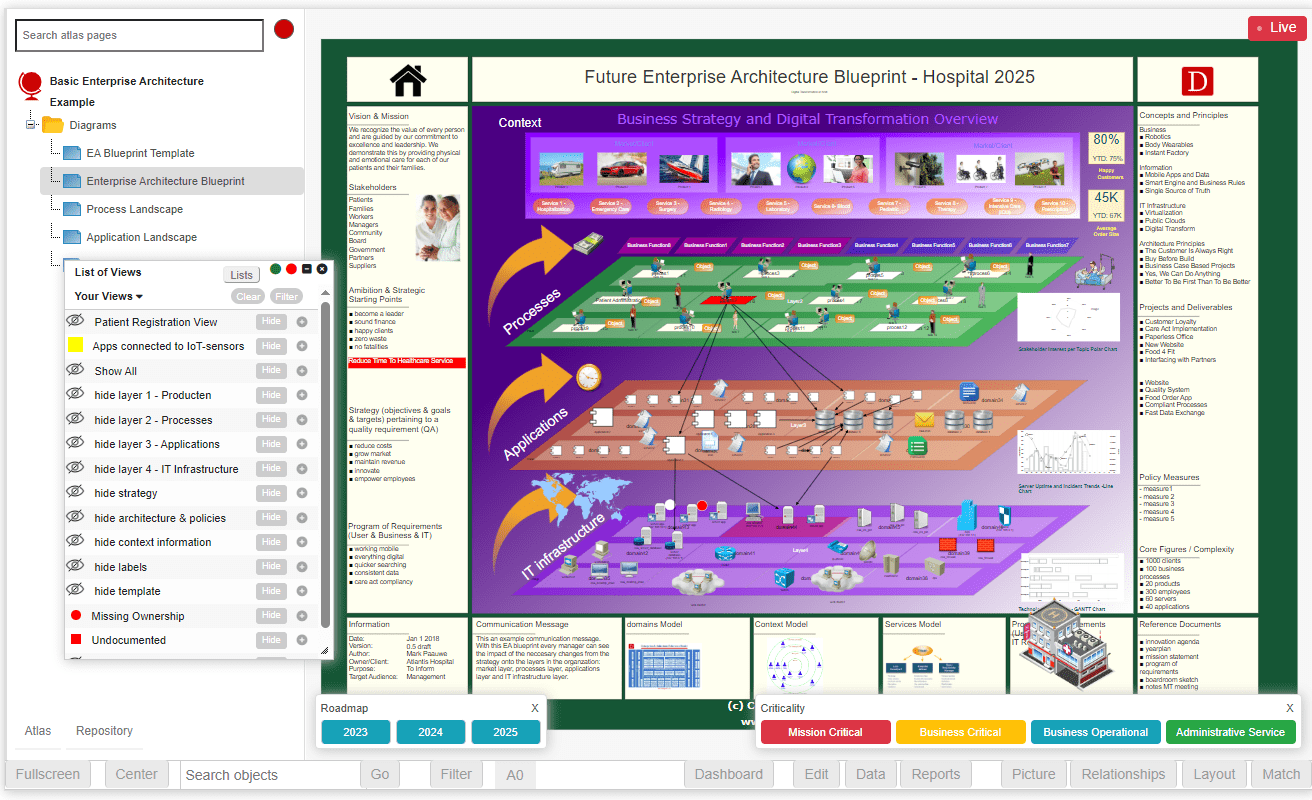
Use the Dragon1 template for an enterprise architecture blueprint to create alignment of strategy with business and IT, to do effective IT planning, and to enable business transformation and innovation.

Use the Dragon1 template for an enterprise architecture blueprint to create alignment of strategy with business and IT, to do effective IT planning, and to enable business transformation and innovation.

Start the Viewer and see a visualization generated in 5 steps:
Next do the demo steps.
You can also follow our free tutorial on generating or building an architecture blueprint from scratch. The tutorial will provide some videos to edit Architecture Blueprints and the dashboard in the Viewer (in edit mode).
Business and Enterprise Architecture Blueprints are diagrams with dashboards of essential value. With the Dragon1 software, users can generate a visualization using any repository or Excel sheet. A visualization template is populated with the imported data. The user can edit the visualization template.
Above, you see a dynamic example of a generated Architecture Blueprint in the Viewer. Click on the red area to click through to the underlying processes and applications. The Dragon1 Viewer is an application that can be used on dragon1.com/viewer, but it can also be embedded on any website or run locally on your laptop or server.
We have provided an Excel Sheet you can use to generate your own Dragon1 Enterprise Architecture Blueprint template by doing the Dragon1 Demo steps.
Skip the Excel to JSON conversion step and directly upload your Excel sheet into the Viewer. Do you need a reliable repository for your data? Create a trial account!
If you're interested in purchasing paid user accounts for your team, reach out to our sales team at sales@dragon1.com. Ensure your team has access to the best tools for effective data utilization.
Click the Demo Steps