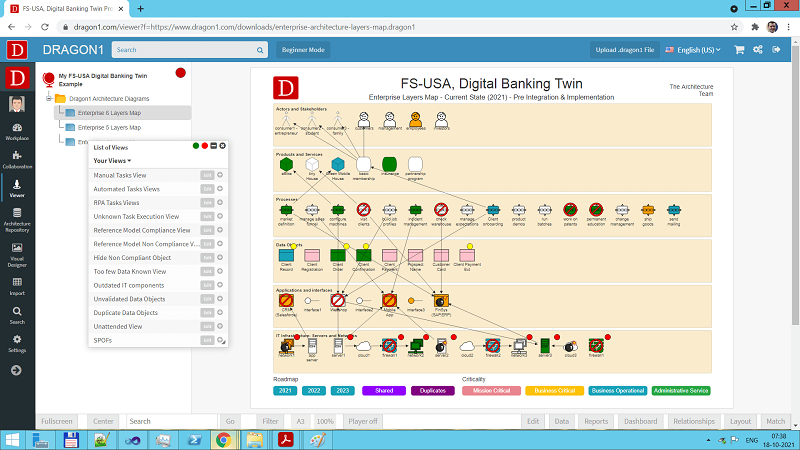
Digital Banking - Enterprise Architecture Layers Demo
The Enterprise Layers Map is a diagram for providing landscape transparency.
The demo is about creating and generating a detailed layered map in the form of a digital banking twin to visualize dependencies between layers.
This demo also shows views that visualize specific viewpoints and perspectives.
By doing the following Dragon1 Demo Steps you can easily generate your own Enterprise Layers Map. The result is a map with tasks. It shows elements of an enterprise organized in layers.

Digital Banking
The demo shows an example architecture layers map of an organization that wants to implement the concept of digital banking.
Digital banking is the digitalization of banking at every level. From front-end to back-end.
A digital bank will rely heavily on artificial intelligence to automate back-end operations. Think of administrative tasks and data processing tasks.
This will make the day-to-day tasks of employees much easier. They will work more productively and efficiently.
When making the transition to digital banking, creating an enterprise architecture, is a pre-requisite. It provides many benefits such as improving alignment, supporting planning and reporting, and managing risk.
Read more about Digital Banking
Why Sign Up for a Free Trial Account?
Would you like to bypass the process of converting an Excel sheet to JSON and directly upload it in the Viewer? Or perhaps you're interested in storing data in the Dragon1 repository? Sign up for a trial account!
Take your company's data usage to the next level by uploading it to your paid user account. Visit the Online Store now to secure your Dragon1 PRO user license, please contact sales@dragon1.com.
Do the Demo with a Data Visualization Template
Download Excel Sheet Upload Excel Sheetenterprise-architecture-layers-map.xlsx
Click on the Demo Steps
toggle- Step 1 Download Excel Sheet Download the Excel sheet here (or green button) containing the data used in this demo. Edit in the Atlas Tab the names of one or two views (class: view). Save them.
- Step 2 Upload in the Viewer Upload the Excel Sheet here (or blue button) with your changes in the Viewer.
- Step 3 Hide RelationshipsClick here to make the diagram easier to understand.
- Step 4 Show Unattended ViewClick here to highlight unattended objects (last view in List of Views).
- Step 5 Hide Non-Compliant Object ViewClick here to show only the related entities.
- Step 6 Clear Views Click here to hide all the views applied in the diagram.
- Step 7 Show Applications LayerClick here to show only the Applications Layer.
- Step 8 Replace IconsClick here to replace icons with a different set.
