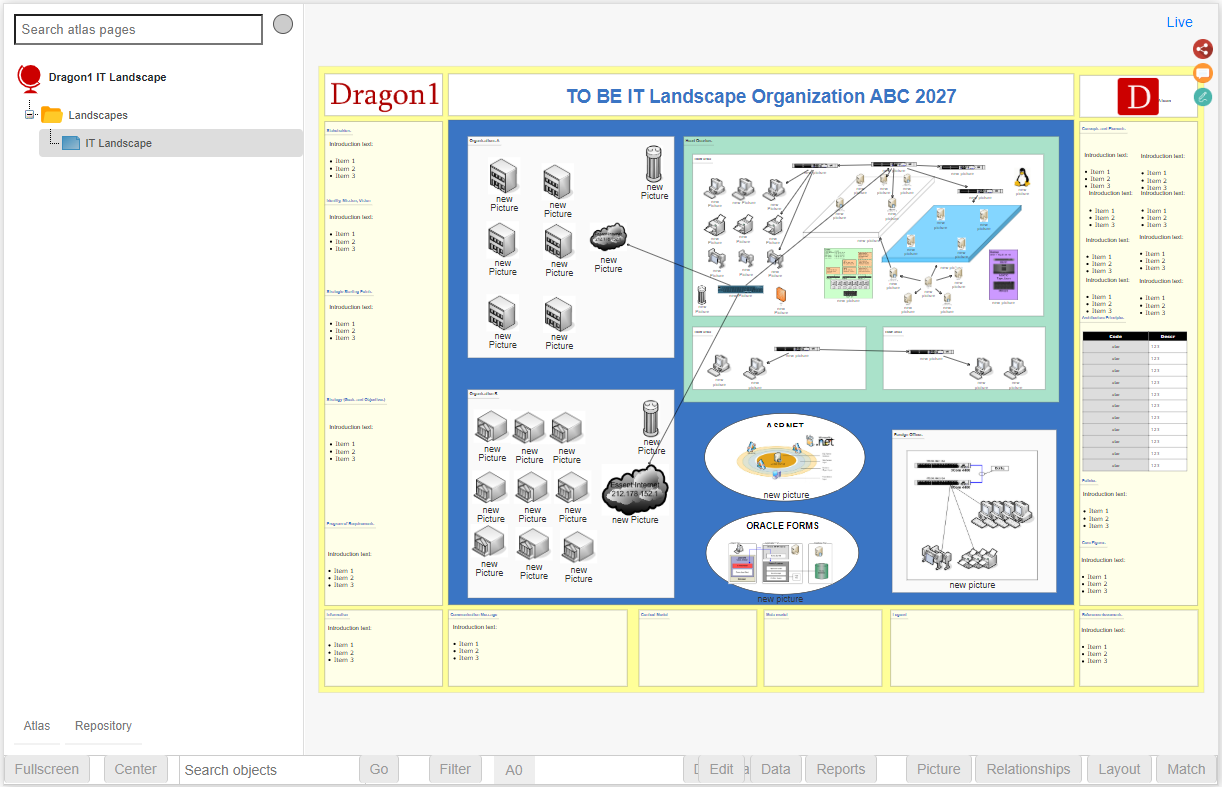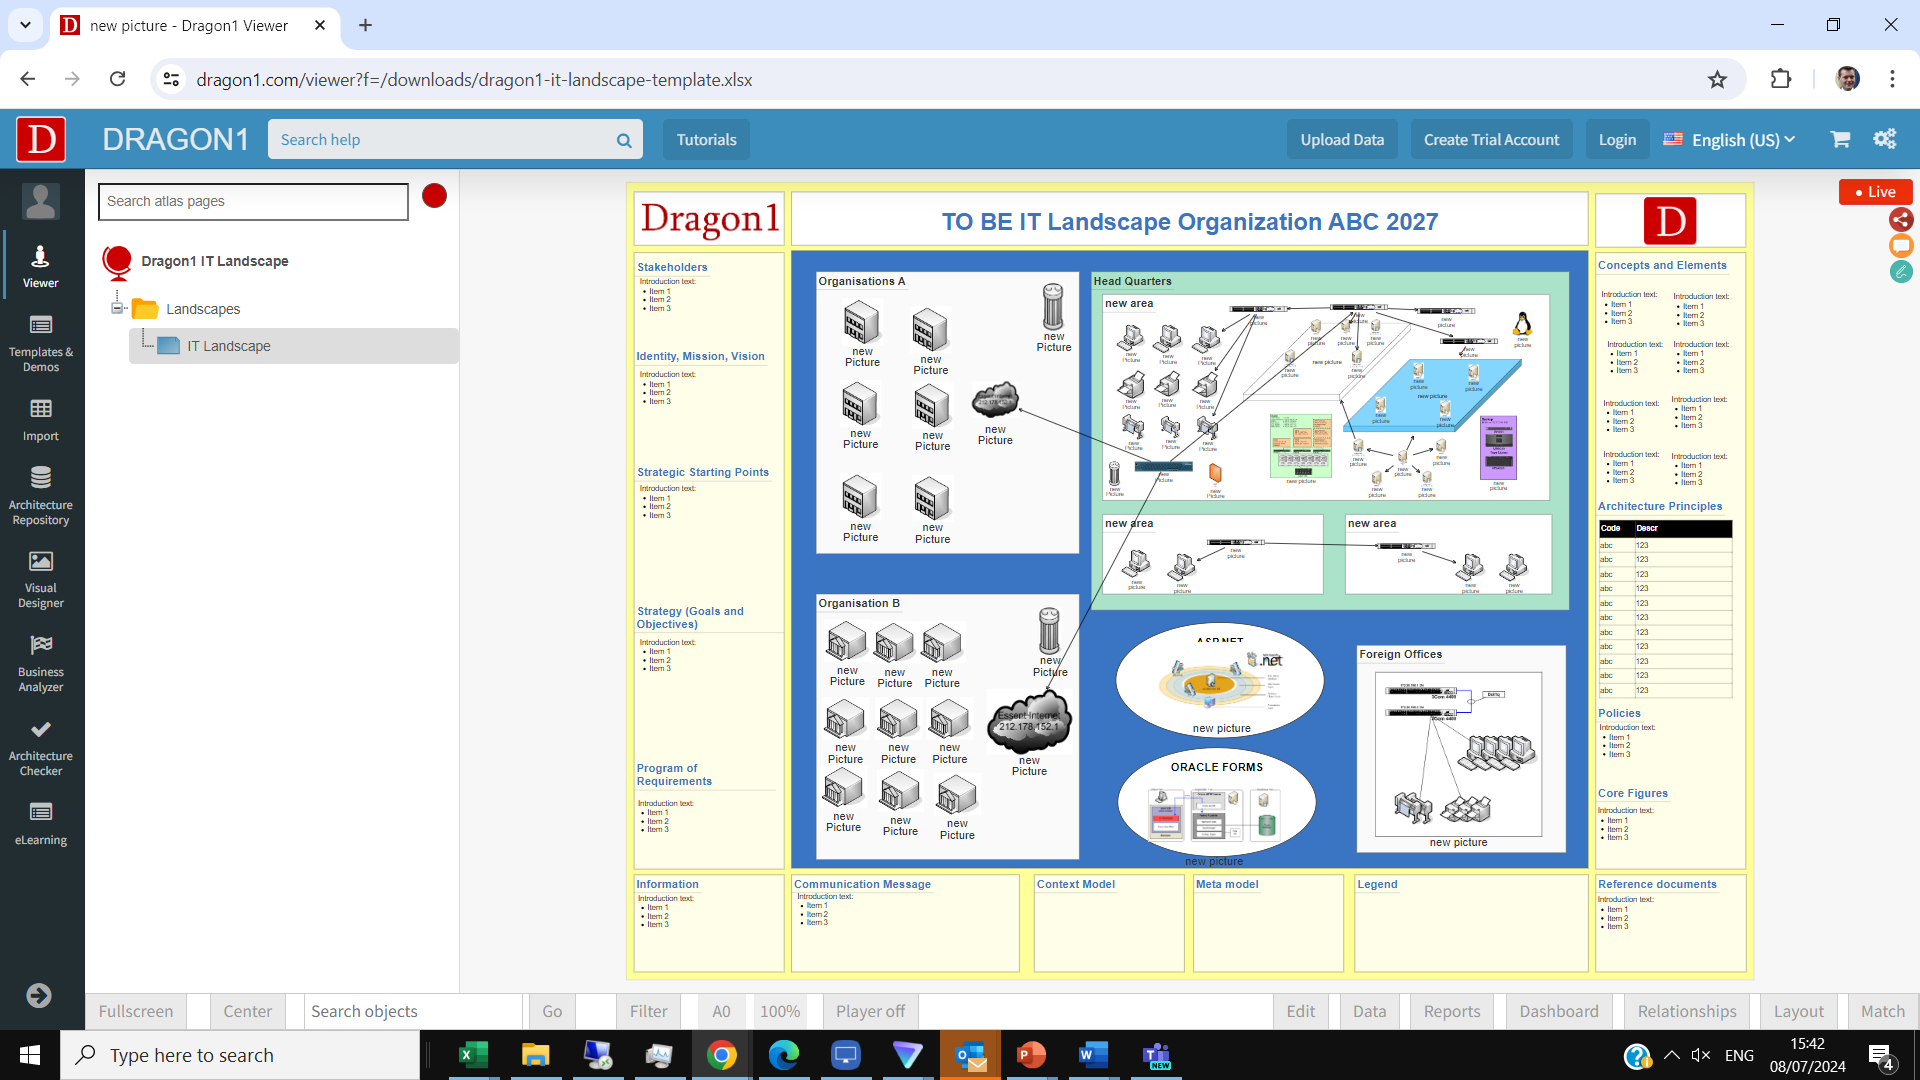

Start the Viewer and see a visualization generated in 5 steps:
Next do the demo steps.
An IT Landscape Diagram (with one or more views) is a product that supports an IT manager in analyzing and improving the IT Landscape of the company. Such as reducing costs and complexity, and improving standardization and alignment with business processes.
You can generate an IT Landscape Diagram by doing the Dragon1 Demo steps.
Above you see an example of a generated IT Landscape Diagram in the Viewer. The Dragon1 Viewer is an application that can be used on dragon1.com/viewer, but it can also be embedded on any website or be run locally on your laptop or server.
We have provided an Excel Sheet you can use to generate IT Landscape diagrams.

Dragon1 supports you in analyzing the generated diagram using its dashboard and managing your transformation within your company, leveraging the diagram and dashboard for effective management.
Want to skip the step of converting an Excel sheet to JSON and upload the Excel sheet directly in the Viewer? Or do you want to store data in the Dragon1 repository? Create a trial account!
If you want to (re)use your company data professionally, you can upload the data to your paid user account. Go to the Online Store to purchase your Dragon1 PRO user license. If you would like to purchase paid user accounts for your team, please don't hesitate to contact sales@dragon1.com.
Click the Demo Steps