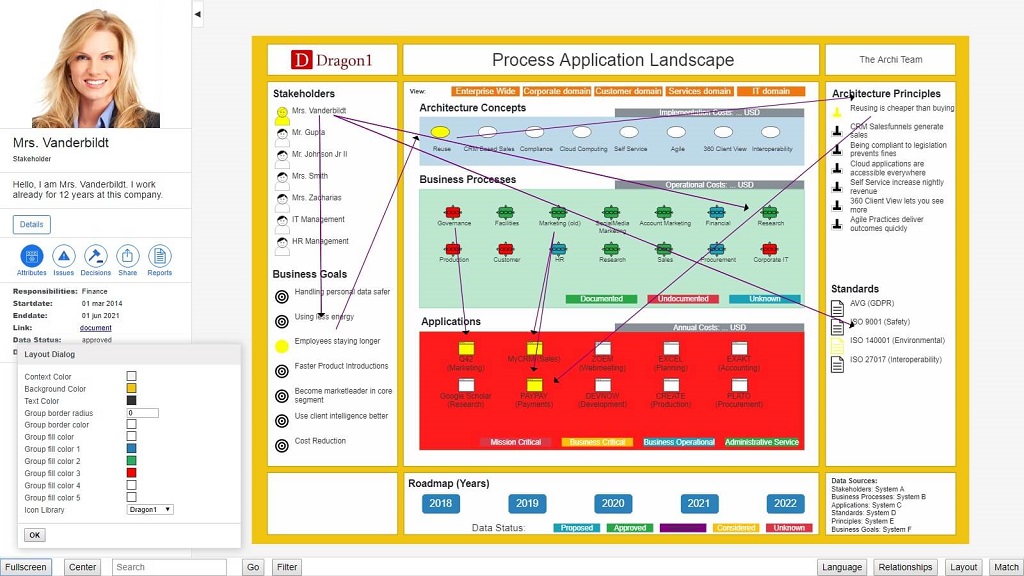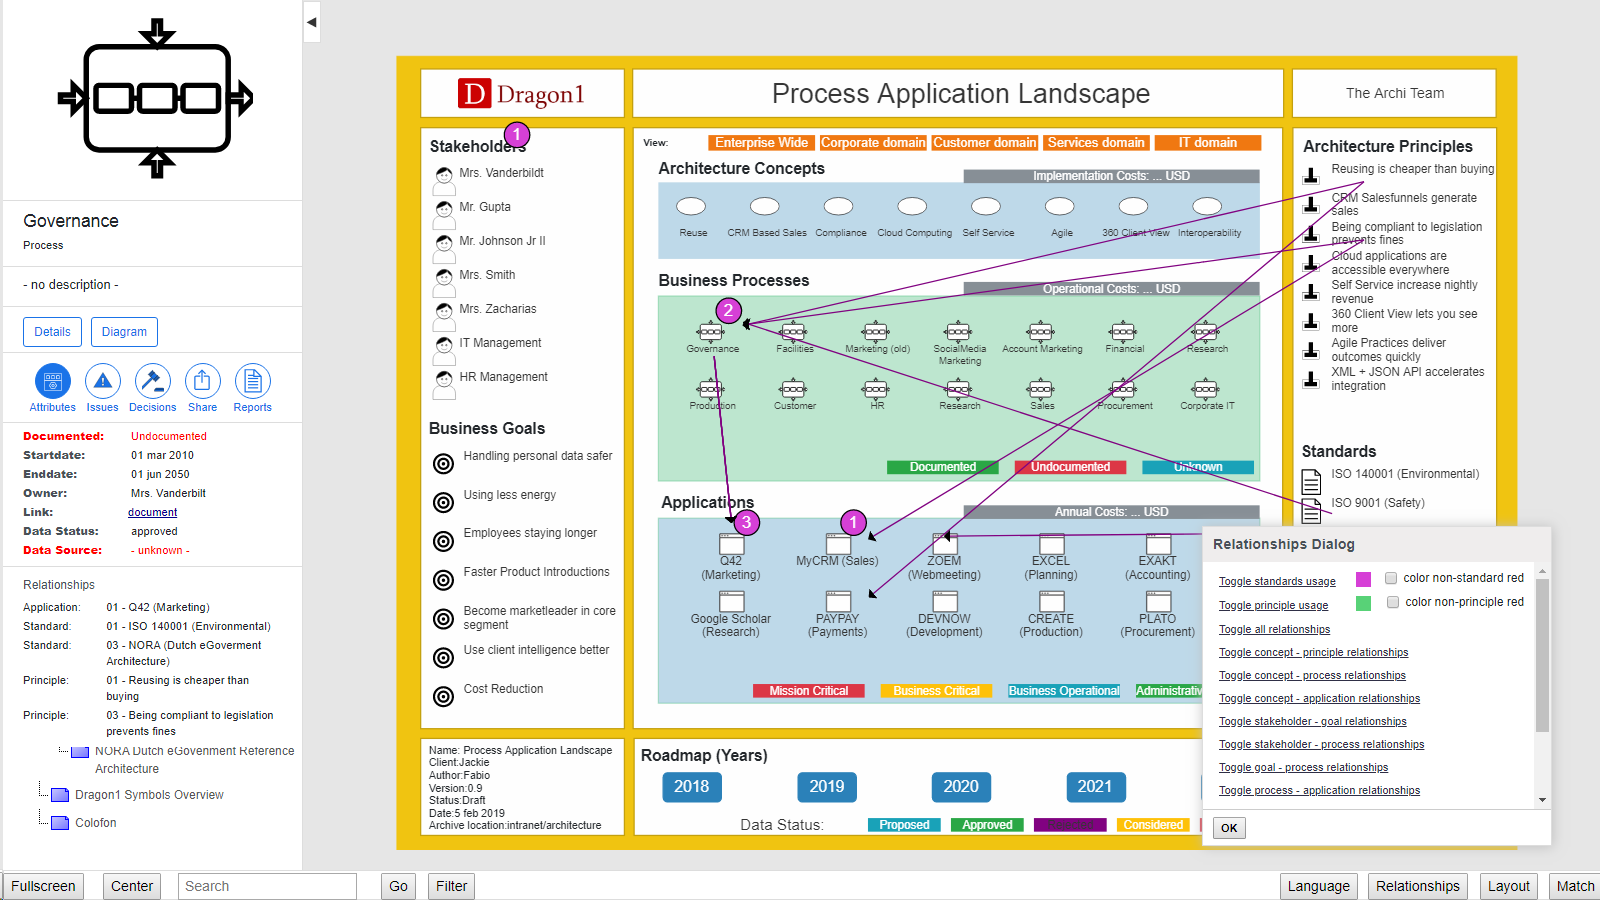

Start the Viewer and see a visualization generated in 5 steps:
Next do the demo steps.
Process Application Maps are diagrams with dashboards of essential value. You and your team can generate visualizations using an Excel sheet and built-in templates in Dragon1 and report with high-quality data for better data integration and data management.
Above, you see an interactive example of a generated Process Application Map in the Viewer. The Dragon1 Viewer is an application that can be used on dragon1.com/viewer. Still, it can also be embedded on any website or be run locally on your laptop or server.
You can yourself also have such a generated diagram by doing the Dragon1 Demo Steps.
We have provided an Excel Sheet you can use to generate your Process Application Map with on Dragon1.
These kinds of interactive diagrams, like a process map and application map, support managing security and risk in your business architecture and IT architecture, such as the lack of standardization or high complexity.
The better you can identify how many processes or applications do not comply with standards or principles, or certain standards and principles are not fully implemented, the better you can report and take action to improve cybersecurity and mitigate risks in the organization.
This diagram is specified in the Dragon1 Modeling language. In the embedded Viewer above, you see a visualization generated from a JSON-structured data file containing the specification of the data, model, and visualization.
Next to generating maps, Dragon1 provides you with features to easily match your architecture diagrams and do a gap analysis.
The Match dialog supports you in comparing reference models with your models. This enables you to see how mature your company is in certain areas.
The filter dialog in the Viewer gives you control to filter any entity based on attribute values. With this, you can create your own view of the diagram as a viewer.
The Viewer provides you with a relationship dialog. This dialog helps you quickly show and hide relationships between a specific class of entities. Specifically, you can toggle on and off the usage relationship of standards and/or principles by entities.

You can make use of Dragon1 in many ways. For instance, stand-alone, in a multi-vendor strategy, or as part of a toolchain.
You can import your data into the cloud-based repository and generate this diagram from there.
Or you can call the diagram type from within your environment, use it as a template, and feed it with a JSON data file.
Want to skip the step of converting an Excel sheet to JSON and upload the Excel sheet directly in the Viewer? Or do you want to store data in the Dragon1 repository? Create a trial account!
If you want to (re)use your company data professionally, you can upload the data to your paid user account. Go to the Online Store to purchase your Dragon1 PRO user license. If you would like to purchase paid user accounts for your team, please don't hesitate to contact sales@dragon1.com.
Click the Demo Steps