Generate a RACI Model Demo
A RACI Model, RACI Matrix (or RASCI chart) are diagrams of essential value. Using Dragon1, you can generate a visualization using a template, and an Excel sheet and focus on high-quality data, resulting in great analysis.
Use RACI Models to:
- Understand the roles and responsibilities of the people involved in a project or line activities.
RACI Model Matrix in Viewer
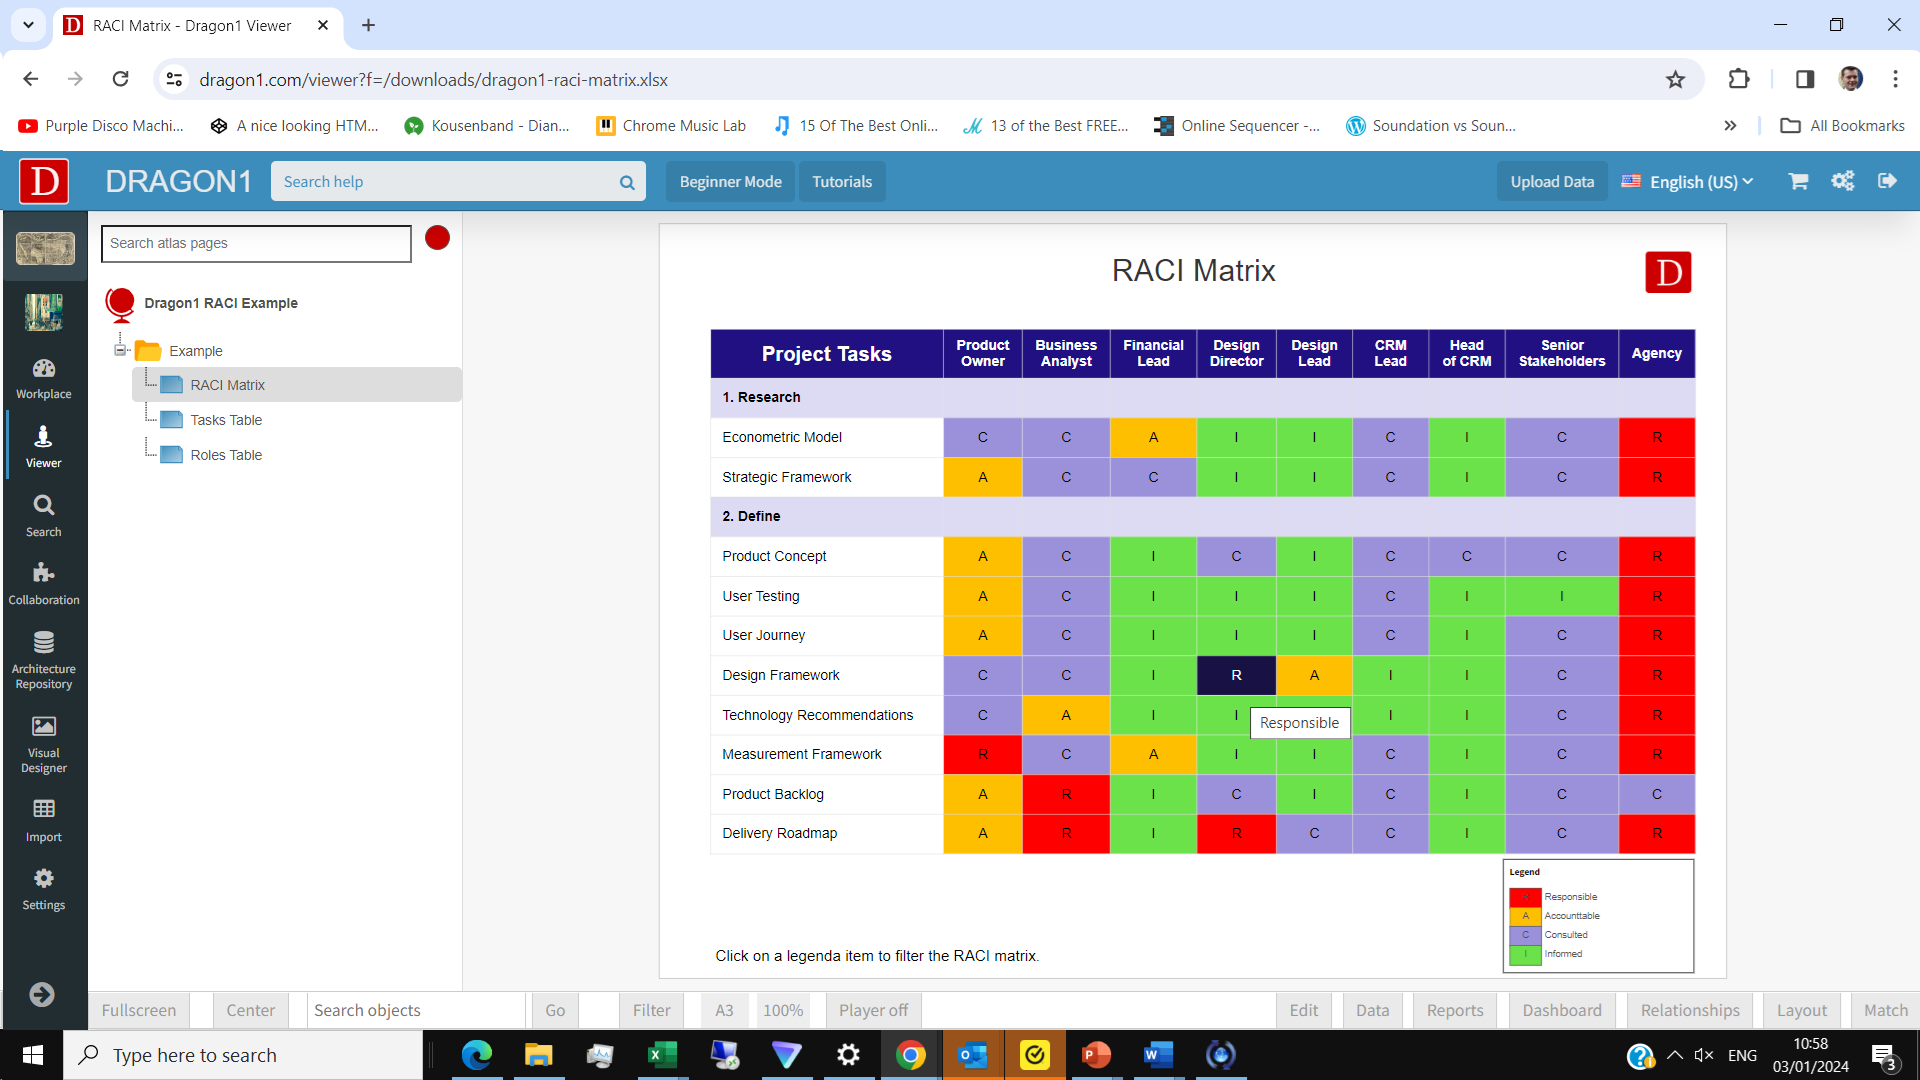
Above, you see an interactive example of a generated RACI Model Template in the Viewer. The Dragon1 Viewer is an application that can be used on dragon1.com/viewer but it can also be embedded on any website or be run locally on your laptop or server.
You can also have such a generated RACI Model by doing the Dragon1 demo steps.
We have provided a Visualization Template and Excel Sheet you can use to generate your own RACI Models on Dragon1.
Measure and Manage Business Processes with RACI Models
In Raci models, the horizontal axis shows the names of the people or the functional roles, and the vertical axis shows the results to be delivered the processes, or activities involved.

You complete the matrix with the employees involved in your process after your process has been improved. After all, the new process often has a new way of working.
A letter (R, A, C, or I) is entered for each combination of a name/role/function and result/process/task. This way you get a clear overview of who is involved in the result/process/task and how. Every task always has an R and an A.
After completion, the raci model is communicated widely, so that employees know who has what role in the improved process.
Take Your First Step: Create a Free Trial Account
Upload your data in the Excel sheet directly to the Viewer or administer it in the Dragon1 repository. Get started with a trial account!
For seamless (re)use of your company data, upload it to your paid user account. Obtain your Dragon1 PRO license today from the Online Store.
Do the Demo with a Data Visualization Template
Download Excel Sheet Upload Excel Sheetdragon1-raci-matrix-chart.xlsx
Click on the Demo Steps
toggle- Step 1 Download Excel Sheet Download the Excel sheet here (or via the green button) containing the data used in this demo. Go to the Tasks tab and change some names of the Tasks. Also, put these names in the rowheaders on the Text tab.
- Step 2 Upload in the Viewer Upload the Excel Sheet here (or via the blue button) with your changes in the Viewer.
- Step 3 Edit Excel Sheet Go to the Roles tab and change some names of the Roles. Also, put these names in the columnheaders on the Text tab. Upload the Excel Sheet and see your changes
- Step 4 Show Responsible View Click here to see only responsible items
- Step 5 Show Accountable View Click here to see only accountable items
- Step 6 Change Title NameClick here and change the title name in the dialog
- Step 7 Change Logo IconClick here and the change logo icon in the dialog
