Additional Filter Options
Search and Filter options
Dragon1 offers all kinds of search and filter options, such as:
- Search box
- Tags
- Meta Data Search
- Filtering by Cabinet and Class
These filter options are described on the page Searching and Filtering.
Besides these filter and search options, Dragon1 offers additional search and filter options.
Filtering Data List View
In each Data List View on Dragon1, items can be searched and filtered in several ways.
Use the following steps to open a Data List View on Dragon1:
- Log in.
- Click on 'Collaboration' on the left side menu.
- Click on 'Data Dashboard' to open the Data Dashboard.
- Click on any tile (e.g., Applications) to open a Data List View.
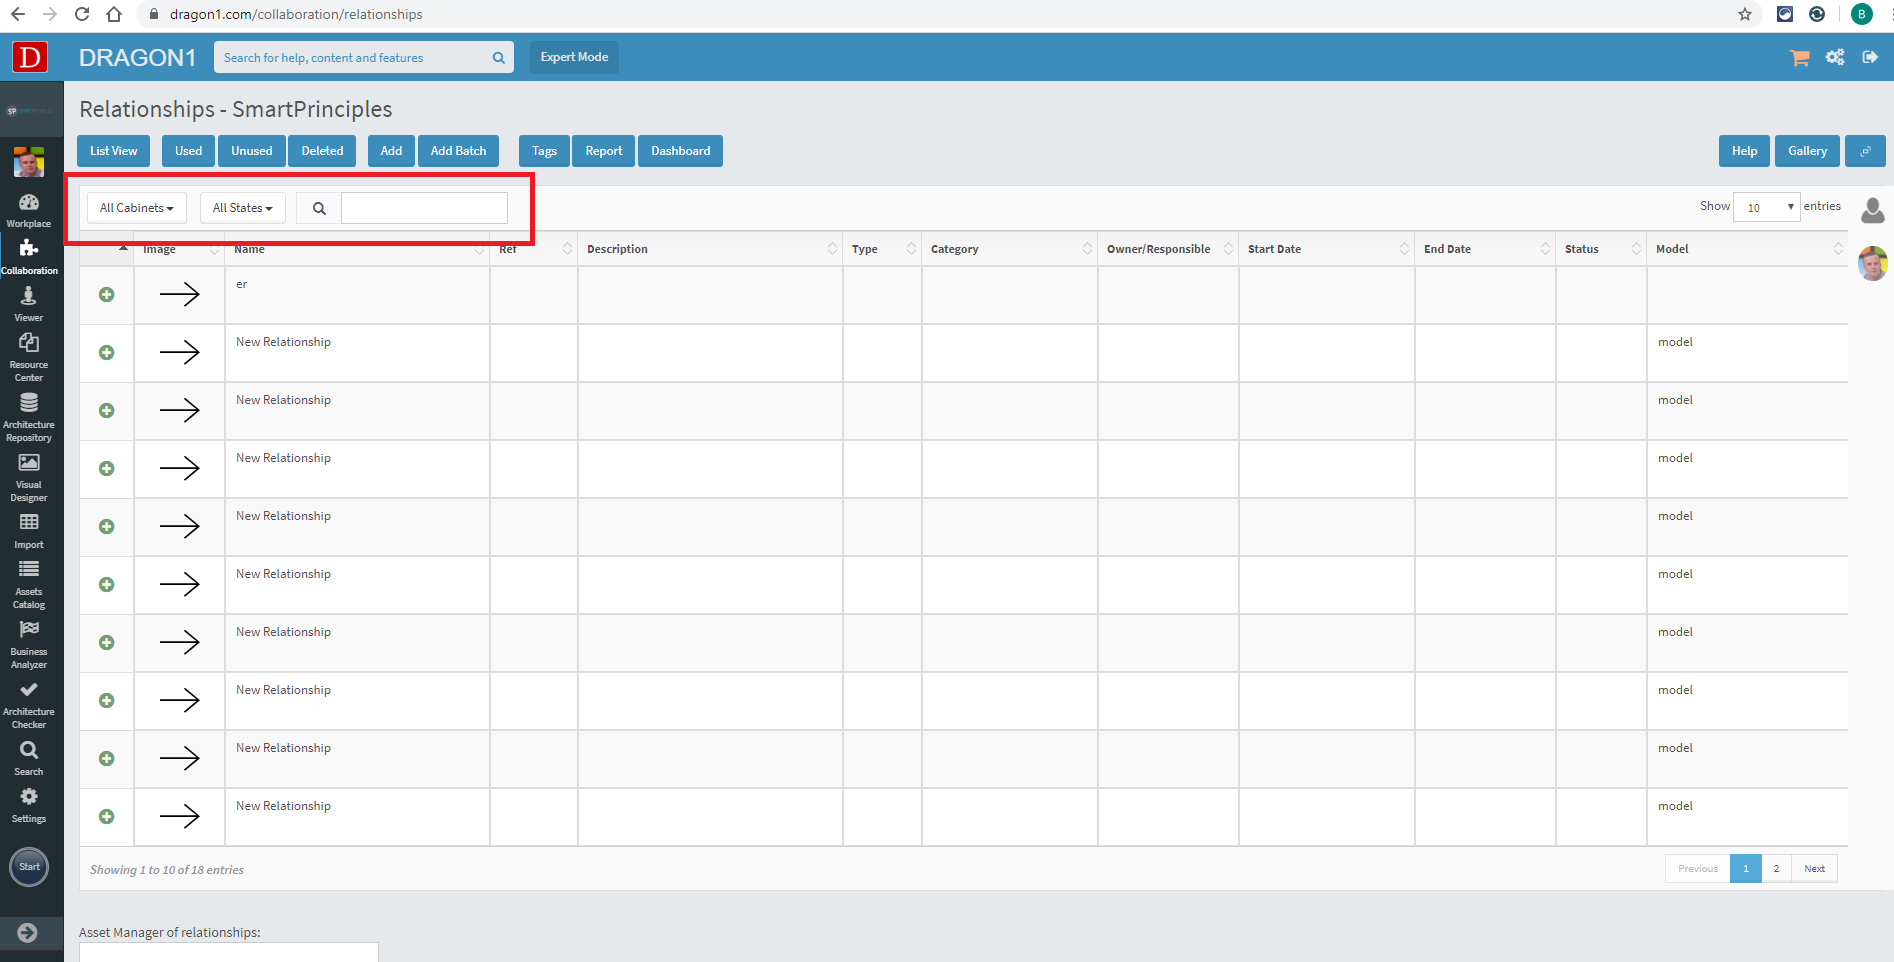
Use the search bar
Using the search bar, items can be filtered by specifying a search term in the box. All items containing the search term will be shown on the list. Furthermore, the filtering can be narrowed down by specifying a state (all, past, current, future).
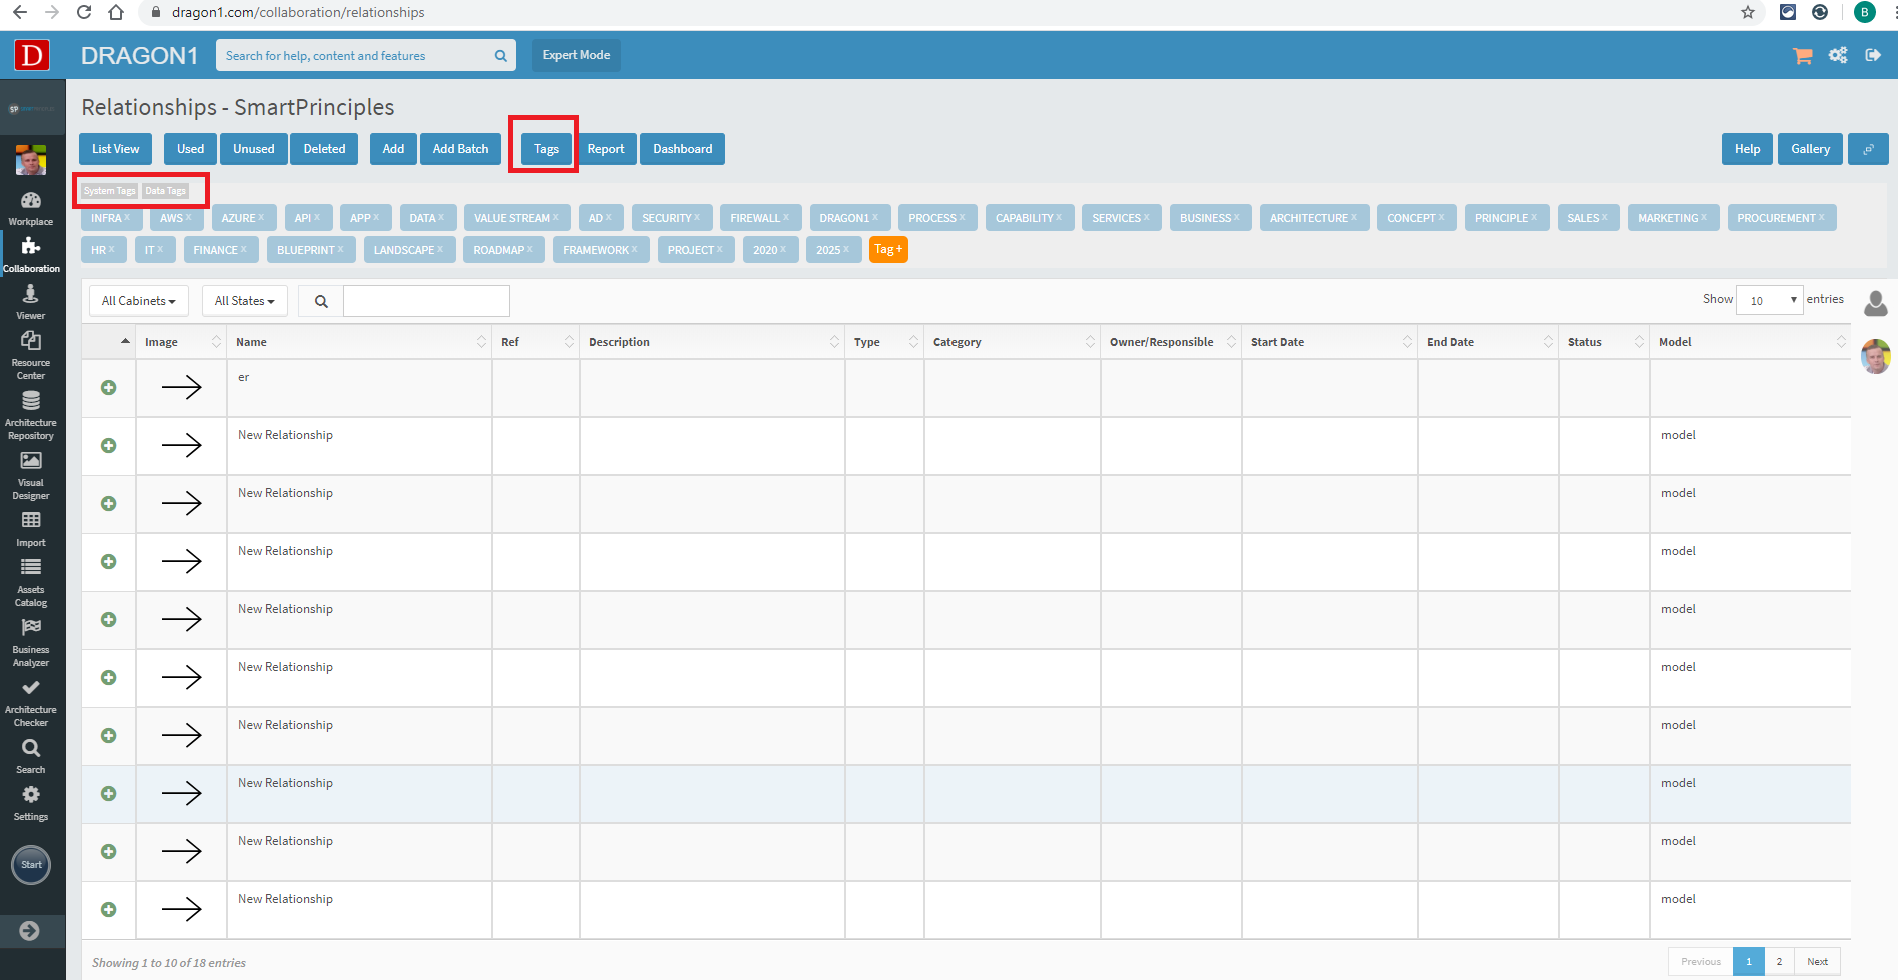
Use Tags
By clicking the 'Tags' button in the top button bar, items can be filtered by clicking one or more system or data tags. The search bar can also be used to enter a search term to narrow down the number of items found.
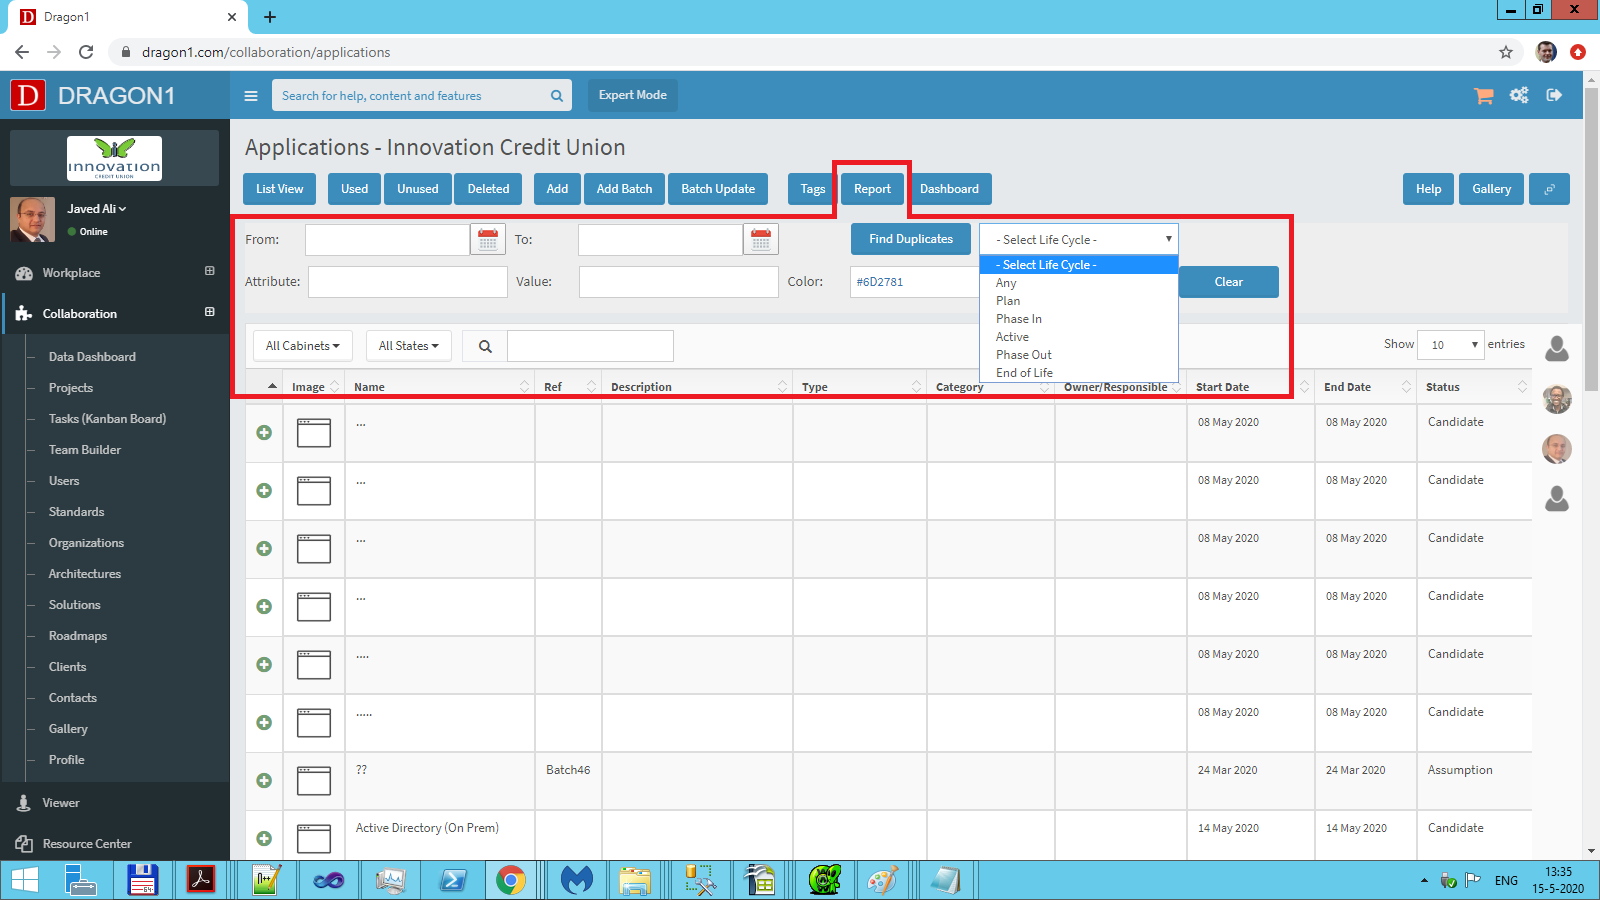
Use Report
By clicking the 'Report' button in the top button bar, a pane appears that can be filtered on date ranges, specific data attributes/value combinations, and a specific life cycle stage. The search bar can also be used to enter a search term to narrow down the number of items found. See Insights through Data Analytics Reports.
Filtering Model in Viewer
When a Model is displayed inside the viewer, many filtering and reporting options are available.
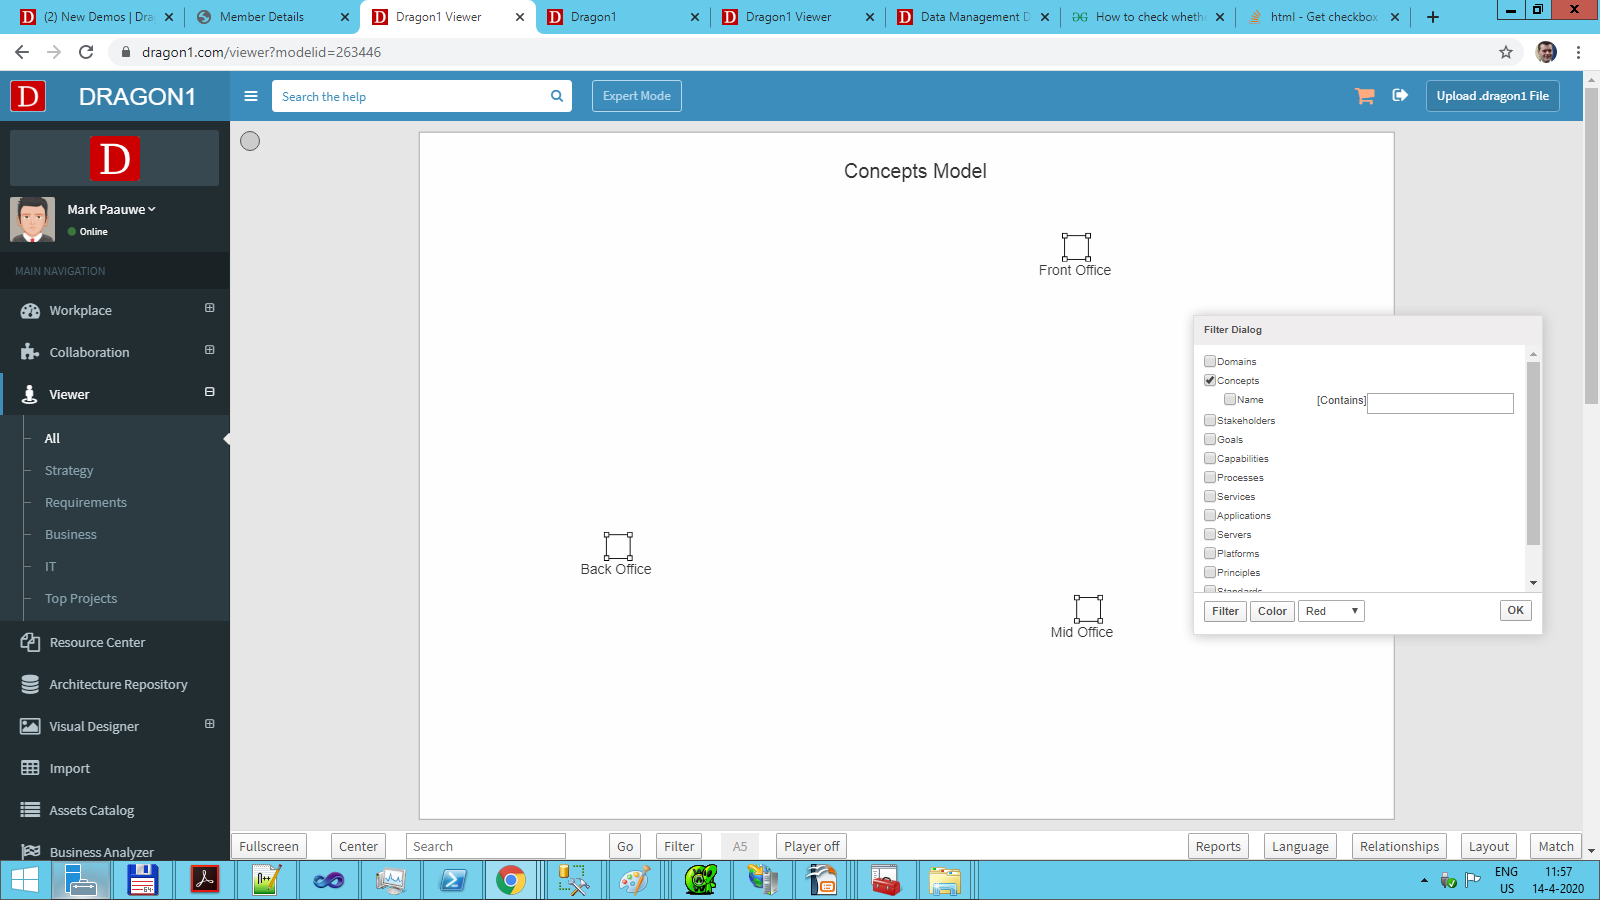
Use Filter
The Filter button has already been discussed on 'Searching and Filtering'. Pressing the button pops up a dialog in which the filter settings can be applied.
Use Reports
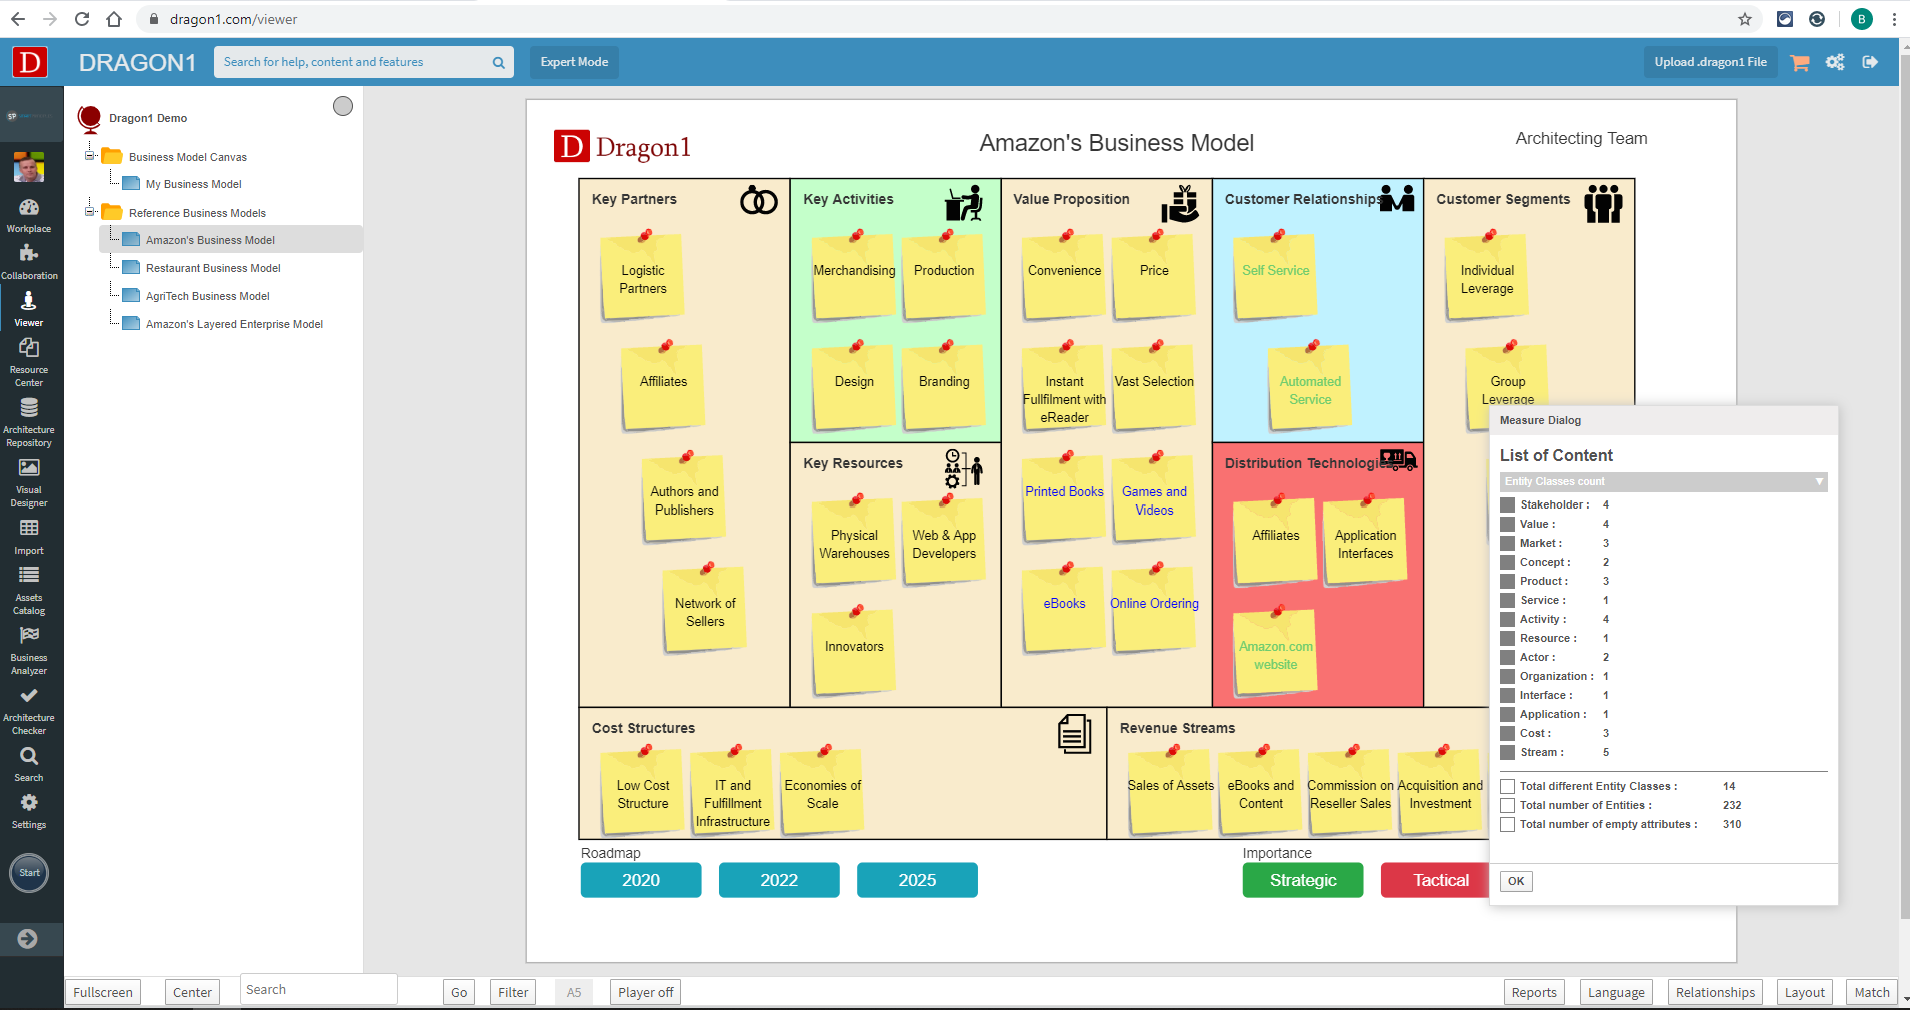
By clicking the 'Reports' button at the bottom of the screen, a pop-up dialog appears in which some reporting options can be selected. The 'Measure Diagram' button is the most interesting for filtering.
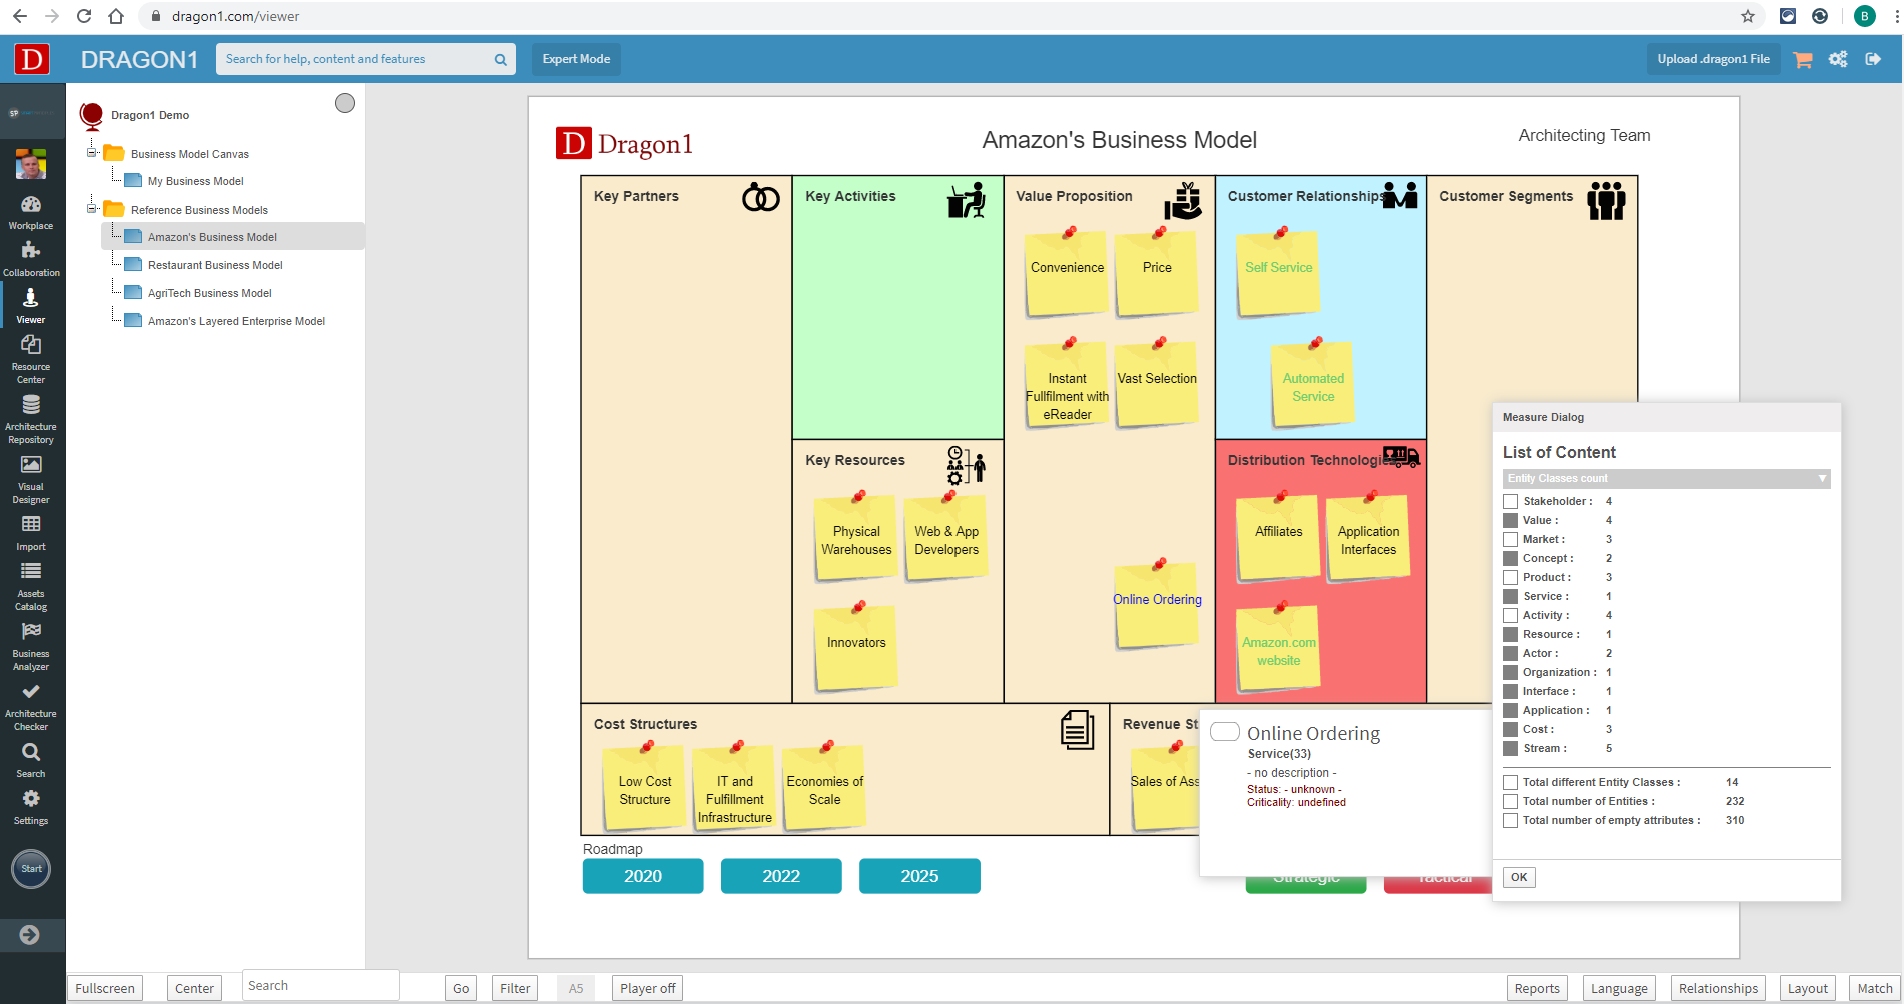
When clicking 'Measure Diagram', a dialog appears where all Entity Classes used in the model are counted. By deselecting the checkboxes in front of the Entity Class (e.g., Stakeholder, Product, Activity), the Entity Classes will disappear from the model.
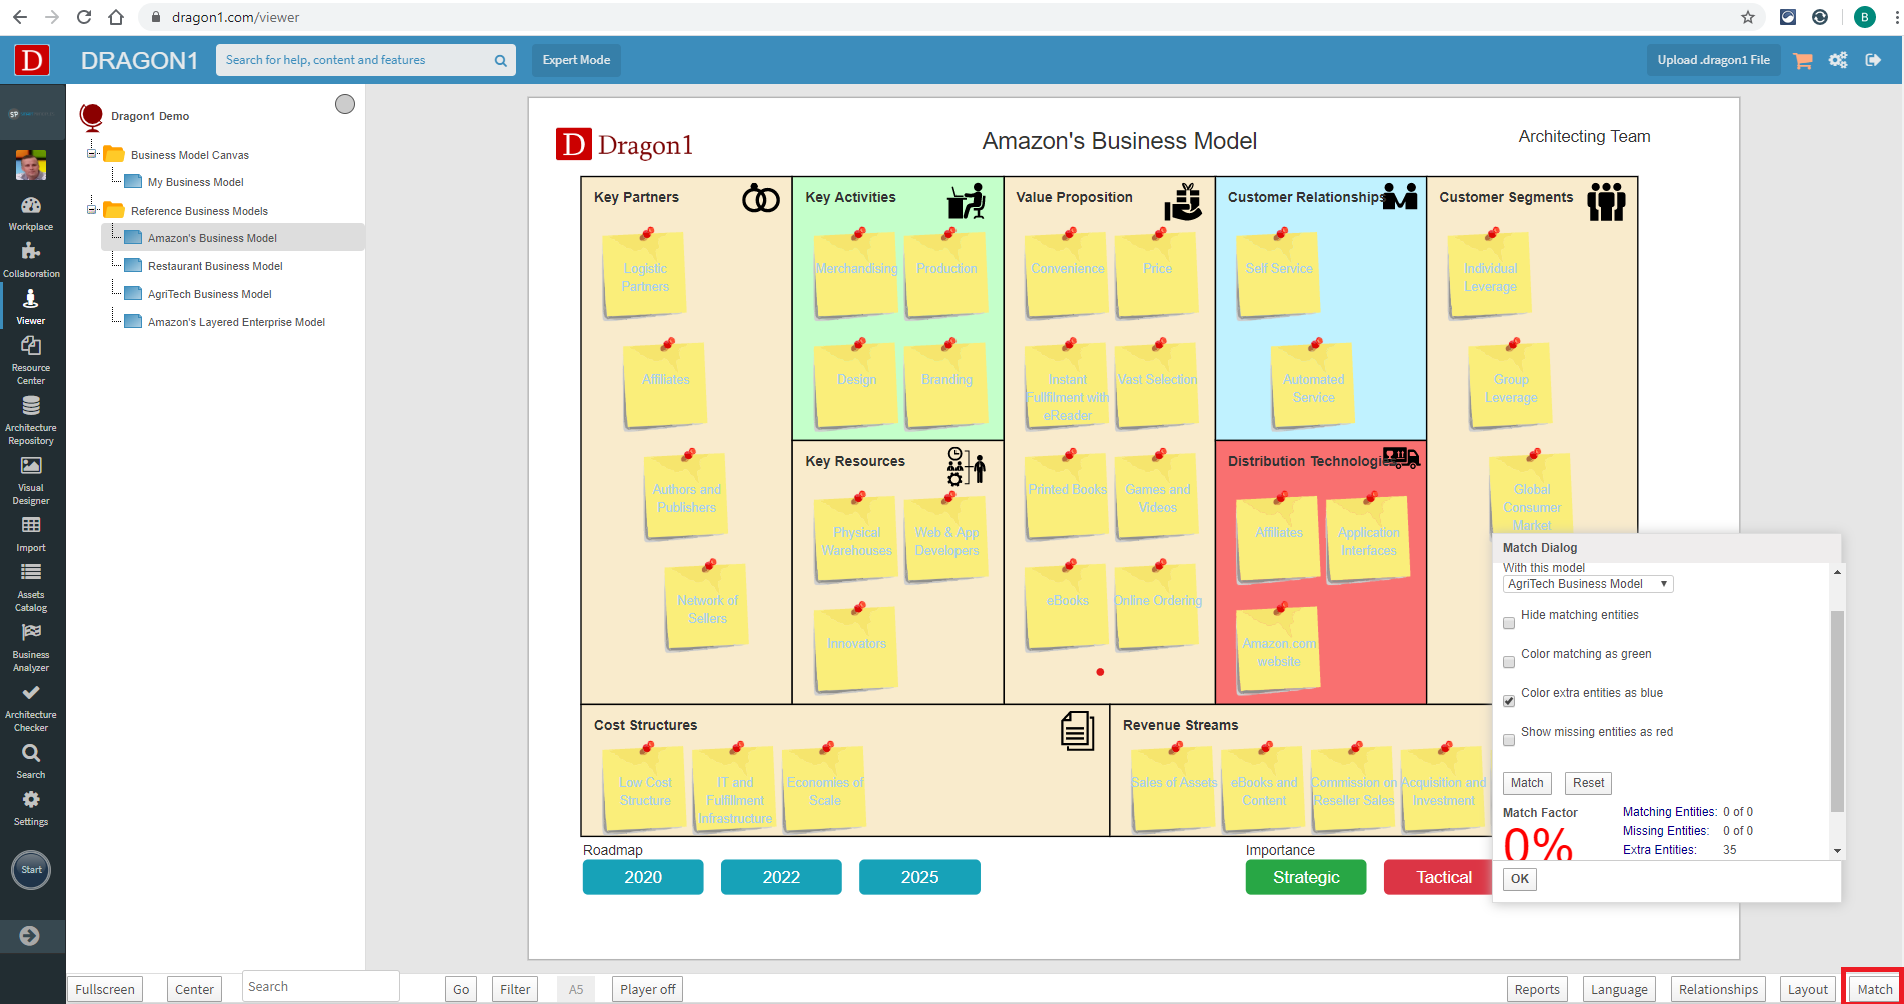
Use Match
By clicking the 'Match' button at the bottom of the screen, a pop-up dialog appears in which models can be compared to others. Using the various options in the pop-up dialog, differences between models, a match factor, and missing entities can be shown.


