Create a Business Model Canvas
About Generating and Creating a Business Model Canvas
In this topic, you learn the basic steps of generating and creating a BMC Business Model Canvas on Dragon1.
The business model canvas is a strategic management template and lean startup schema for developing innovative or documenting current and future state business models.
It is a visual map with areas describing a company's or product's customers, value proposition, finances, and infrastructures.
This canvas of a business model is the perfect tool to help you understand your business model much better. In a straightforward and structured way.
On the Dragon1 Platform, the Business Model Canvas is available as a template and accessible in the Visual Designer and the Viewer.
How To Generate A Business Model Canvas using an Excel Sheet
To generate a BMC using an Excel sheet and a visualization template:
- Download the example Business Model Canvas excel sheet here.
- Open the sheet in Excel or Open Office
- Edit the data to your situation (fields marked with yellow color)
- Click on Save
- Go to the Import module.
- Click on the Upload button and select your Excel Sheet file
- Dragon1 has converted your Excel Sheet into a .dragon1 File (JSON structured)
- Click on the Download .dragon1 File button
- Go to the Viewer
- Click on Upload .dragon1 File (the button at the right top)
- Select your .dragon1 file
- You see your generated business model canvas
- Next, you can add extra diagrams to your atlas that show details of the items on the business model canvas
- To see generated dashboards, put the Viewer in edit mode (Click on Edit in the button bar below) and click on the Dashboard button
- Click on the Icons button to hide the Icons menu. This often gives the best view for working with dashboards
How To View a Business Model Canvas
To view a BMC
- Go to the Viewer
- If you are logged in, you need to select 'show demos' in the Viewer to see the template
- Click on the business model canvas template
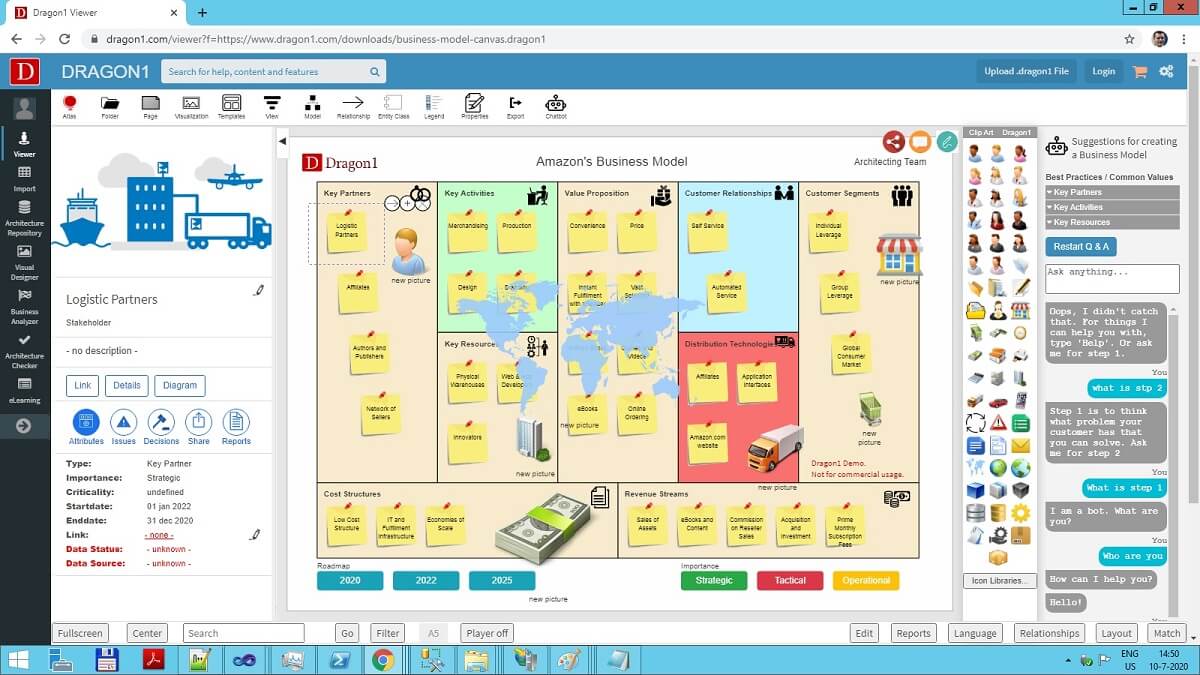
- Now you see an interactive/clickable business model canvas generated from a .dragon1 file
- Click on a post-it shape in the diagram to see the details of the item you clicked on at the left.
- NOTE: You can work with data in a repository or a file as a user.
Download and view the .dragon1 File
Dragon1 offers you to work file-based (JSON structured) and repository-based (in a SQL Server database management system).
The example above has the data in a .dragon1 file. A .dragon1 file is JSON structured on the inside.
To download and view this BMC template file:
- Click on this link to download the business-model-canvas-template.dragon1 file containing the business model data.
- You can open the file in any text editor, like Notepad.
- Click on the filename in the download bar at the bottom of your browser. You now see the .dragon1 File text opened in Notepad or other attached text editor to the file open event.
- Edit or change the title value and team value of the visualization in the file
- Save the modified .dragon1 File in a folder on your computer
- To view your edits, go to the Viewer (If you are logged in, you need to select 'show demos' in the Viewer, to see the template)
- Click on the Upload .dragon1 File button at the right top of the Viewer
- Select your file from your computer and open the file
- Now you see your modified business model in the BMC template
- NOTE: You need to be logged in to be able to save changes in a .dragon1 file or the repository.
How To Create a Business Model Canvas
You can create a BMC on the fly, directly in the Viewer, in the Data Dashboard, or in the Visual Designer.
We will first describe the Viewer way.
To create a business model canvas:
- Go to the Viewer
- If you are logged in, you need to select "show demos" in the Viewer, to see the template
- Click on the business model template
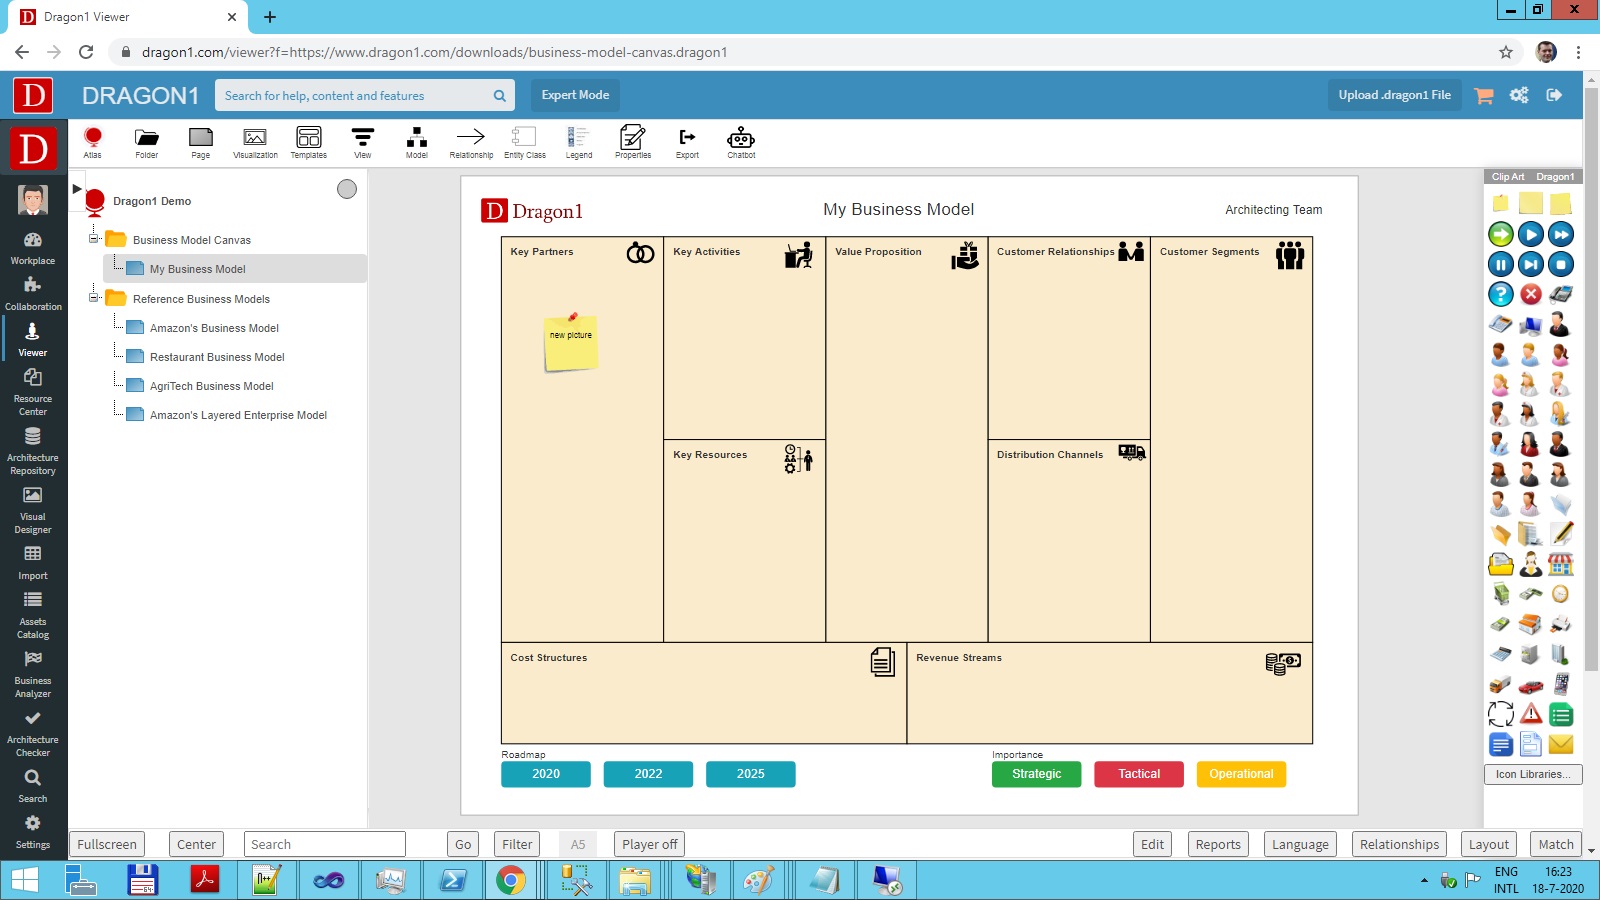
- Select the empty business model canvas visualization (My Business Model)
- Click on the Edit button (in the button bar below)
- Click on the Clip Art menu item (at the right top of the shapes toolbar)
- Now you can drag Post-it shapes onto the canvas
- Be sure to drag at least two shapes to the canvas and create (draw) a relationship between them via the toolbar at the top-right of the shape. (In the background, you create a model in this way that is linked to this visualization.)
- Click on one of the post-it shapes. On the left side of the canvas, click on the name of the shape. You can edit the name.
- Press TAB or click next to the input field to update the name in the visualization.
- Click on the Browser Button.
- Select the added shape (f.i. picture)
- Add a property in the 'type' field
- Fill in “Key Partner” as a value if you want the shape to be linked/positioned in the Key Partners area of the canvas (this is the default value). Other values are 'Key Activity', 'Key Resource', 'Value Proposition', 'Customer Relationship', 'Customer Segment', 'Revenue Stream', 'Distribution Channel', 'Cost Structure'.
- Press TAB and click on the OK button.
- If the Viewer does not update your visualization automatically, click in the treeview at the left to refresh your visualization (if your left panel is covering the treeview, collapse it by clicking on the arrow-left icon)
- You can also add any other shape from the icon bar at the right to the canvas. Based on the type property value, they are positioned on the canvas.
- To delete a shape: click on a shape in the diagram and click on the cross in the smart tools menu with the shape.
- You can drag any shape to the business model canvas, like the clip art shapes, to make it more appealing for the Viewer.
- NOTE: You must be logged in to save changes in a .dragon1 file or the repository.
You have created a business model canvas in a .dragon1 file.
If you want to be guided by a chatbot in creating a business model, click the Chatbot button.
Create a BMC with the Data Dashboard and Repository
To create a BMC via the Data Dashboard and Repository:
- Log in.
- Go to the Data Dashboard via the collaboration menu item.
- Follow the instructions to create an atlas
- Follow the instructions to create an atlas page. Link the atlas page to the atlas.
- Follow the instructions to create a visualization and select the business model canvas. Link the visualization to the atlas page
- Follow the instructions to add stakeholders, activities, value proposition, etc.. in the repository.
- Follow the instructions to create a model and relationships
- Link the model to the visualization
- Go to the Viewer
- Select the created atlas
- View your business model
How To Edit the Template
To rename the groups on the canvas:
- View a visualization with the business model canvas template in the Viewer
- Click on the Edit button (in the button bar below)
- Click on the Browser button
- Uncheck the Show Data Only checkbox
- Now visualizations become visible in the list
- Select the visualization you want to rename groups for
- Click on Add Property
- Name the property group1 or group2, etc...
- Click on OK
- Fill in a name for the group
- Click on OK
- Refresh the visualization by clicking on the tree item at the left


