Creating Clickable Lists
On almost every Dragon1 visualization, you will use lists.
It can be a bullet list, an icon list, an order list, or a number list.
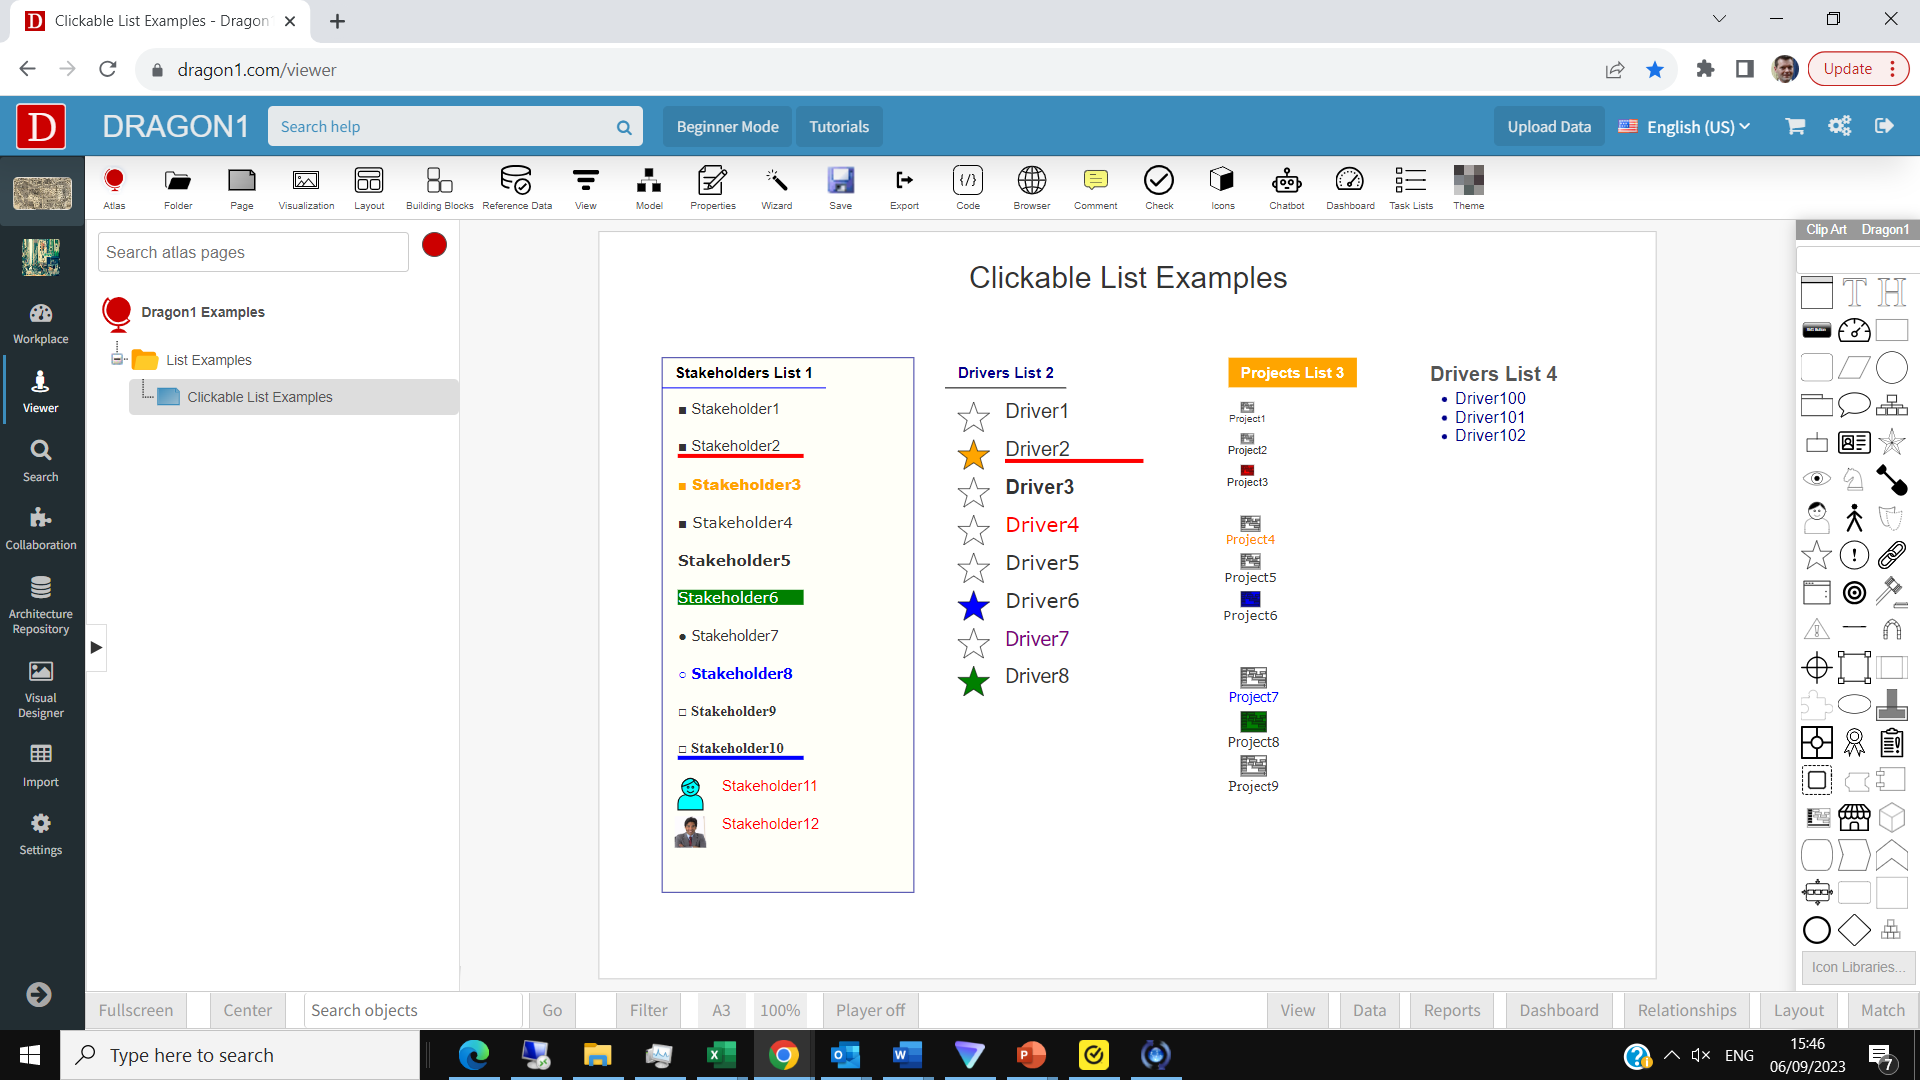
Below is a live example of several lists.
Download the Excel sheet and upload the file in the Dragon1 Viewer.
How to create a Clickable List
To create a clickable list via Excel (Option 1):
- Enter data on TABs in an Excel sheet (like the example shows and as is explained on this page).
- Upload the Excel sheet in the Viewer
To create a clickable list via the Repository (Option 2):
- Enter data in the Repository via the Data Manager
- Create an Atlas, Folder, and Page
- Create a Visualization with Areas
- Link the Visualization to the Page
- Create Styles and Constants
- Link the Data to the Area
- Optionally: export it to an Excel Sheet
Data Sources
Basically there are 3 sources of data Dragon1 can use: the Dragon1 repository/database, Excel Sheets & CSV files, any rest API, JSON & XML files.
Data
The live Excel sheet example shows 3 data lists and 1 HTML list.
The 3 data lists show a list of stakeholders, drivers, and projects.
In the Excel Sheet, you see a TAB for stakeholders, drivers, and projects.
The attributes for these entities required are:
- id
- class
- name
- ref (optional)
- alias (optional)
- type
- descr
- shapetype (optional) - here, you can specify another icon to use
- tags
- group
- weight
- style (optional)
- ...for styling attributes like shapestyle, X, Y, Width, Height, Fill, and Stroke, see below...
- report
- reportstyle
- link (optional) - here, you can specify a URL or visualizationid to jump to
- document (optional)
- status (optional)
- owner (user-defined example)
You can also add stakeholders, drivers, and projects in the Repository via the Data Manager and use that as the data source.
Define at the atlas or visualization datasource=repository level in the descr field or as datasource attribute with the value repository.
datasource=file will enforce that the data is not taken from the Repository.
The default for the datasource is the Repository.
Areas
The data (on the TABs) can be shown in areas.
An area is a rectangle or other shape, with a certain x,y position and width, height.
Area can be linked to a class of entities, types of entities, and instances of entities via the dataclass, dataid, dataattribute, and datavalue attributes.
Area can contain subareas. Area can be positioned as absolute or relative.
Also, entities can be linked to areas via the group attribute
The Area TAB shows how the areas are configured for this example.
Important attributes for the areas are:
- id
- class
- name
- ref (optional)
- alias (optional)
- type
- descr
- tags
- group
- dataclass
- dataid
- dataattribute
- datavalue
- sortorder (optional) - example: A-Z or Z-A or weight
- style (optional)
- distribute (optional) - example: spacearound, spaceevenly, or spacebetween
- distributevertical (optional) - example: spacearound, spaceevenly, or spacebetween
Styles / List Markup / Layout
The styling and layout of the lists can be completely separated from the data, but mixed fully or partially.
You can add a Style TAB in the Excel Sheet and use the styles with any entity via a style attribute
The example Excel Sheet shows a styling TAB
The following common styling/markup/layout attributes are available
- shapestyle (optional) - example: item or listitem or text or label
- icon (optional) - example: bullet, circle, whitecircle, square, whitesquare, checkmark, or none
- x (optional) - example: 100px
- y (optional) - example: 100px
- width (optional) - example: 100px
- height (optional) - example: 100px
- fill (optional) - example: green of #00ff00
- stroke (optional) - example: darkblue or #ffff00
- strokewidth (optional) - example: 3px
- fontsize (optional) - example: 24px
- fontweight(optional) - example: bold or normal
- fontfamily (optional) - example: Arial
- padding (optional) - example: 24px
- margin (optional - example: 24px
- color (optional) - example: cyan or #f1234f
- background - example: #ff00ff or purple
- border
- textalign
- verticalalign
For more info on HTML Color Codes, check: https://htmlcolorcodes.com
Use constants to create a gradient color.
Note that px means pixel and often can be omitted.
HTML Lists
The Viewer and Excel sheet support creating an HTML list.
Draw a Text element on the canvas in the Viewer.
Select the Text element.
Click the View button to place the Viewer in Edit mode.
At the left panel, enter the HTML-formatted table in the description attribute of the Text Element.
You can also place an HTML string in the descr attribute of a text element in the Excel Sheet. See the example for this.
Constants
- to do-
Interactivity
List generated as described on this page is interactive.
When you move over the items, you see a pop-up dialog box showing certain attributes.
At the Atlas TAB, you can control the shown attributes with the card and panel attributes for a visualization.
If you click on an item in the list, the left panel shows the details about the item.
If the report attribute is filled, this text is also shown in the left panel. The report style provides the background color and text color to use.
If the link attribute is filled with an entity, the Link Button on the left panel will turn blue upon selecting it.
Click on the blue button to jump to the configured visualization or URL.


