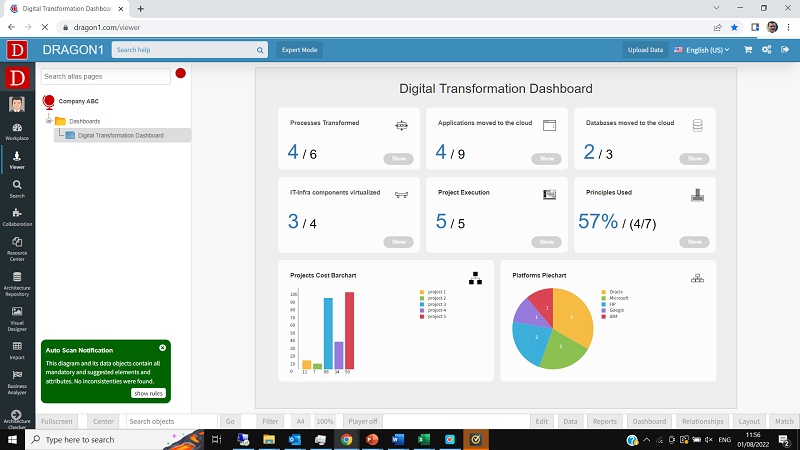
Creating Dashboards
Dragon1 supports you of how to create a dashboard consisting of widgets called indicators.
Example Dashboard visualization.
Example Dashboard File
Download the example file and upload it to the Dragon1 Viewer
dragon1-dashboard-example.xlsxHow to Create a Dashboard
To create a dashboard, the following steps need to be taken:
- Create an atlas
- Create a visualization
- Create a model
- Link data (from the repository or in the Excel Sheet) to the model.
- Create indicators (the widgets of the dashboard)
- Link the indicators to the model and/or visualization
Indicator Rule
An indicator needs to have a rule and template configured.
You can place the rule in the ActionScript field.
Some indicators have multiple places where a number or figure can be placed.
Examples of rules are:
- countClassAttr(Process,tags,digital);
- countClass(Principle,tags,used);
- listClassAttrOnName(Project,Budget);
- A=Count(Server, tags, outdated) - This will count the servers that are tagged outdated. The number will be put in the A place of the widget
- A=Count(Server, tags, outdated);B=CountDates(Server, tags, outdated, 1 Feb 2010, 1 Mar 2022) - The results of the rules will be put in the A and B place of the widget.
The date format to use always is dd mmm yyyy.
As date also today and last year can be used.
Indicator Template
Examples of indicator templates are:
- percentage_planned_actual
- percentage_planned_actual_ytd
- total_planned_actual
- planned_actual
- planned_actual_ytd
- total
- total_ytd
- percentage
- percentage_ytd
- barchart
- piechart
- graph
Indicator Layout
The layout of the indicators can be configured for the following attributes:
- panel: rectangle or rounded rectangle
- background color
- text color
- font family
- font style
In the workplace, you will have a tasklist for creating a dashboard visualization with indicators.
Indicator Bar
On a visualization, it is also possible to place an indicator bar.
An indicator bar is a set of indicators.
You can position that bar anywhere on the visualization at an absolute position (x,y) or predefined position (left-top, right-bottom, etc...)

