How to Create a DYNAMIC Use Case Diagram
This lesson familiarizes you with the Visual Designer, the web application you need to build models and diagrams with. You will become familiar with the structure of a project and learn how to navigate between basic project components, using them correctly.
Throughout this lesson, you will start making a dynamic UML Use Case Diagram. For example, your colleagues can view the result in the Viewer. When you are finished, your Use Case Diagram will look something like this:

Create a Dynamic Use Case Diagram.
This lesson will teach you how to create a DYNAMIC visualization. A dynamic visualization consists of four parts: DATA, MODEL, VIEW, and VISUALIZATION.
You can also draw static use case examples online or other visualizations using templates. But see other tutorials for that.
Learning Objectives
To learn to create a dynamic use case diagram, we will provide you with the following:
- What is a UML Use Case Diagram
- Create a standard Folder Structure
- Insert Data
- Insert a Model
- Insert a View
- Insert a Visualization
First, you need an existing folder structure or create a new folder structure. In that folder structure, we will put data (entities). We are going to relate the entities into a model. Then, we create a view (a filter) on top of that model, and finally, we are going to connect the view with a visualization canvas, creating a diagram.
What is a UML Use Case Diagram?
The UML modeling language defines a use case diagram. That is a graphical schema showing a formal actors-systems-functions model.
A use case model consists of actors, a system, the functions or activities of a system, called use cases, and the environment to which the system belongs.
A use case is used in systems analysis to identify, clarify, and organize systems requirements.
By creating use case diagrams, you build a representation of sequences of interaction between users and a system or its functions. You show the relationships and the different use cases in which the user is involved in a particular environment and related to a particular goal.
Create a standard Folder Structure

To create a standard folder structure:
- Create a New Cabinet or open an existing Cabinet using the corresponding button on the Button Bar
- Expand a Dossier in the Explorer Treeview by clicking on the plus sign if it already has folders. If not, select New Dossier by clicking on its name.
- Click on Insert Folder and type in the name of the folder in the name field of the New/Edit Dialog, inserting the following top-level folders: Data, Model, Relationships, View, Visualization.
- In the folder Data, create the following subfolders: strategy, architecture, and transformation
Insert Data
This is the first step out of four steps: Data, Model, View, and Visualization, for every dynamic diagram to take. We will enter data that later on will be connected to the model.

To insert data for a use case diagram:
- Select a data folder, for instance, the folder Strategy
- Click on Insert Actor in the Draw Entity drop-down menu
- Select the added Actor in the Explorer Treeview
- Click on Edit in the Button Bar. A New/Edit Dialog will appear
- Enter a correct name in the New/Edit Dialog (for example: chef)
- Click OK
- Insert three actors like this (for example: waiter, client, cashier). You may also choose the entities of stakeholders or persons, if you like, instead of actors.
- Insert nine use cases (or functions or activities) in the Draw Entity drop-down menu like this (for example: order food, serve food, eat food, etc.)
Insert a Model
This is the second step out of four steps: Data, Model, View, and Visualization, for all dynamic use cases. We will draw a model where every entity will be connected to a data item. When the name of the data item changes, the visualization, in the end, will show that change automatically.
You can create a model in three ways: by dragging shapes from the panel, data from the explorer, or by inserting shapes from the drop-down menu. In this tutorial, we drag shapes from the shapes panel.

To insert a model, do the following:
- Select a folder in the Explorer Treeview, for instance, the folder Model
- Click on Insert Model in the Button Bar. A New/Edit Dialog will appear
- Enter a correct name in the New/Edit Dialog (for example: Restaurant Use Case)
- Click OK
- You see a model entity added in the treeview
- Select the model entity in the Explorer Treeview
- Drag the same number of actor shapes from the Shapes Panel as you have entered as data and give them the same names or other names
- Drag the same number of use cases (ovals) from the Shapes Panel as you have entered as data and give them the same names or other names
- Link the actors and use cases by using the smart tools around the shapes to draw the connections
- Select the connections and give them names in the Inspector Connection Panel. Select a connection by doing a mouseover over the connection, and then click on the black wheel icon. Now, the connection properties are selected in the connection panel in the Inspector at the right.
- Link the Shapes to the entered data (entities) in the data folder by entering the Entityclass and Entity Id in the Inspector Shapes Attributes panel. The Class and Id of an Entity can be found in the tooltip of an Explorer Treeview item
- Save the Model


You now have a model linked to the entered data.
Insert a View

To insert a View:
- Select the folder View in the Explorer Treeview
- Click on Insert View in the Button Bar. A New/Edit Dialog will appear
- Enter a correct name in the New/Edit Dialog (for example: Actor view) and click OK
- You see your view added in the Explorer Treeview
- Select the View in the tree view and click Edit in the Button Bar
- Select in the Identity TAB the correct model in the drop-down list at Model Uplink
- On the Behavior TAB in the New/Edit dialog, enter 'onload' for the rule event
- On the Behavior TAB in the New/Edit dialog, enter 'Entityclass=Actor' for the rule condition. We want all data to be let through
- On the Behavior TAB in the New/Edit dialog, enter 'show(name)' for the rule action. We want to see the names of the entities
- Click OK to save the view
You have now a view (a filter) of a model showing only the actor items of the model.
Insert a Visualization

(This visualization shows a visual item, that generates the actors on the visualization using the Stakeholder shape. Setting up the visual item is discussed in the next steps.)
To insert a visualization where you are going to put the view of the model on:
- Select the folder Visualization in the Explorer Treeview
- Click on Insert Visualization in the Button Bar. A New/Edit Dialog will appear
- Enter a correct name in the New/Edit Dialog (for example: MyRestaurant) and click OK
- You will see your visualization added in the treeview
- Click Edit in the Button Bar if you want to change the name of the visualization
- Select the Visualization in the tree view and click Edit in the Button Bar
- Select in the Identity TAB the correct view in the drop-down list at View Uplink
- Drag a square shape to the visualization canvas
- Select the shape and go to the Text Attributes at the Inspector
- Change the title of the square into 'System boundaries'
Insert A Visual Item
We will create Visual Items (little visualization fragments). A Visual Item is a data/shape placeholder connected to a view and put on a visualization canvas. You can put as many visual items on a canvas as you like. With Visual Items, you show shapes on a canvas for the data in a view.
In the next steps, we are adding a Visual Item on the canvas and configuring it to generate some shapes for the data in a view.
- Fill in 'onload' in the rule event field
- Fill in 'Entityclass=Actor' in the rule condition field (we want all data from the view to be shown)
- Fill in 'show(name)' in the rule action field (we want the shapes to show names)
On the Help is a page with extensive documentation and examples of configuring rules.
- Click OK to save the Visual Item data
- Select your visualization
- Switch to NORMAL mode in the player bar to have the rule of the view shape interpreted
- You will see Stakeholder shapes with the Actors' names next to a system box on your visualization.
- If you also want to have the use cases shown in your diagram, add a second Visual Item and repeat the steps above or change the first View and Visual Item rule into 'Entityclass=*', so it will show the whole model.
The following screenshots show the different TABs on the New/Edit dialog for the Visual Item:
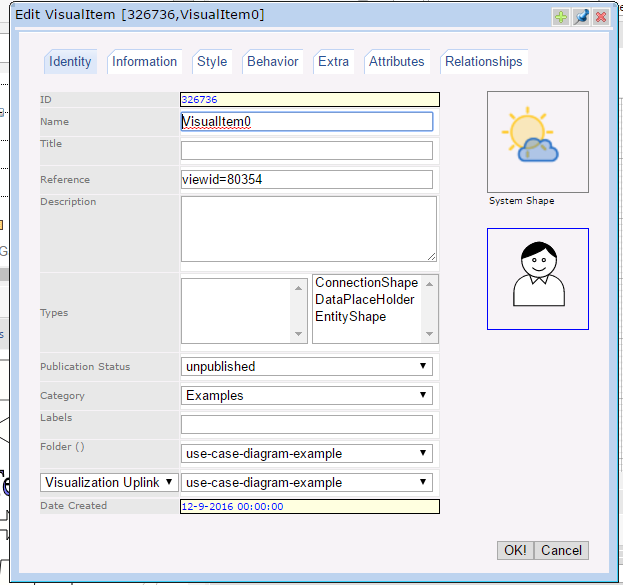
(Fill in the viewid in the REF field and select a visualization uplink)
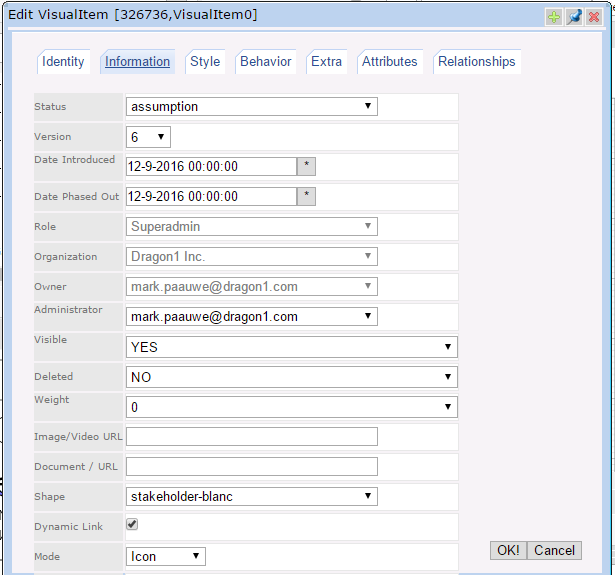
(Select a shape to be used on generating)
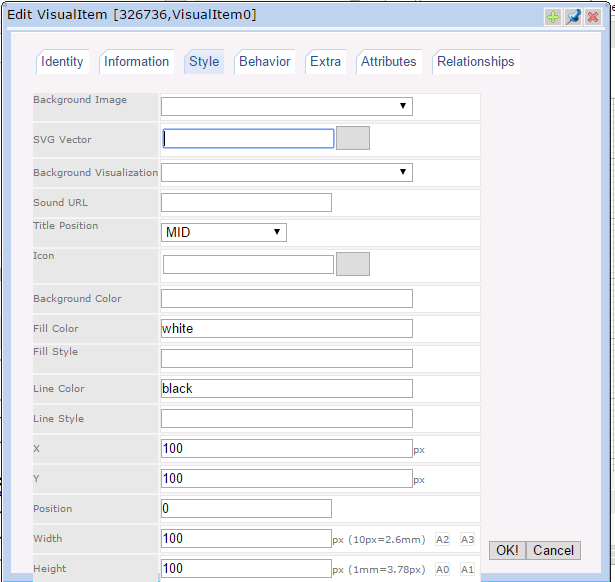
(Fill in width and height for the shapes to be used)
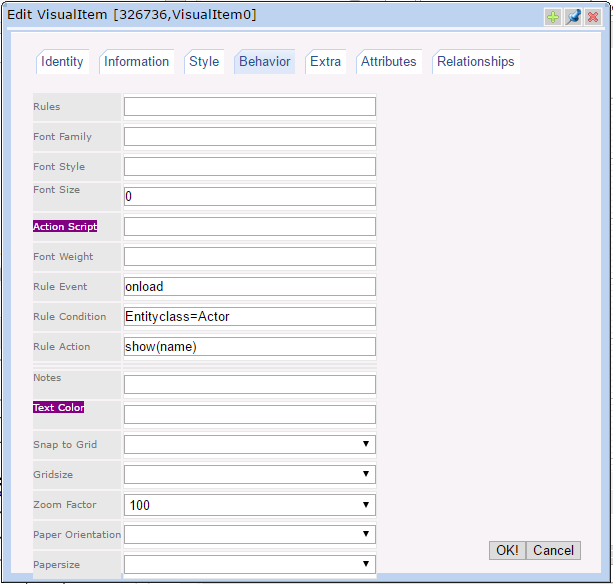
(Configure the rule)
CONGRATULATIONS!!!
You did create a DYNAMIC Use Case Diagram.
You can, for instance, vary with the rule attributes and see how the diagram changes. Change the data and see how the diagram is automatically updated.
Change the name of a data item, go to the Presentation Mode, select your model, view and visualization to see the changes made.