Create and Generate a Visualization
Three Ways of Creating and Generating Visualizations
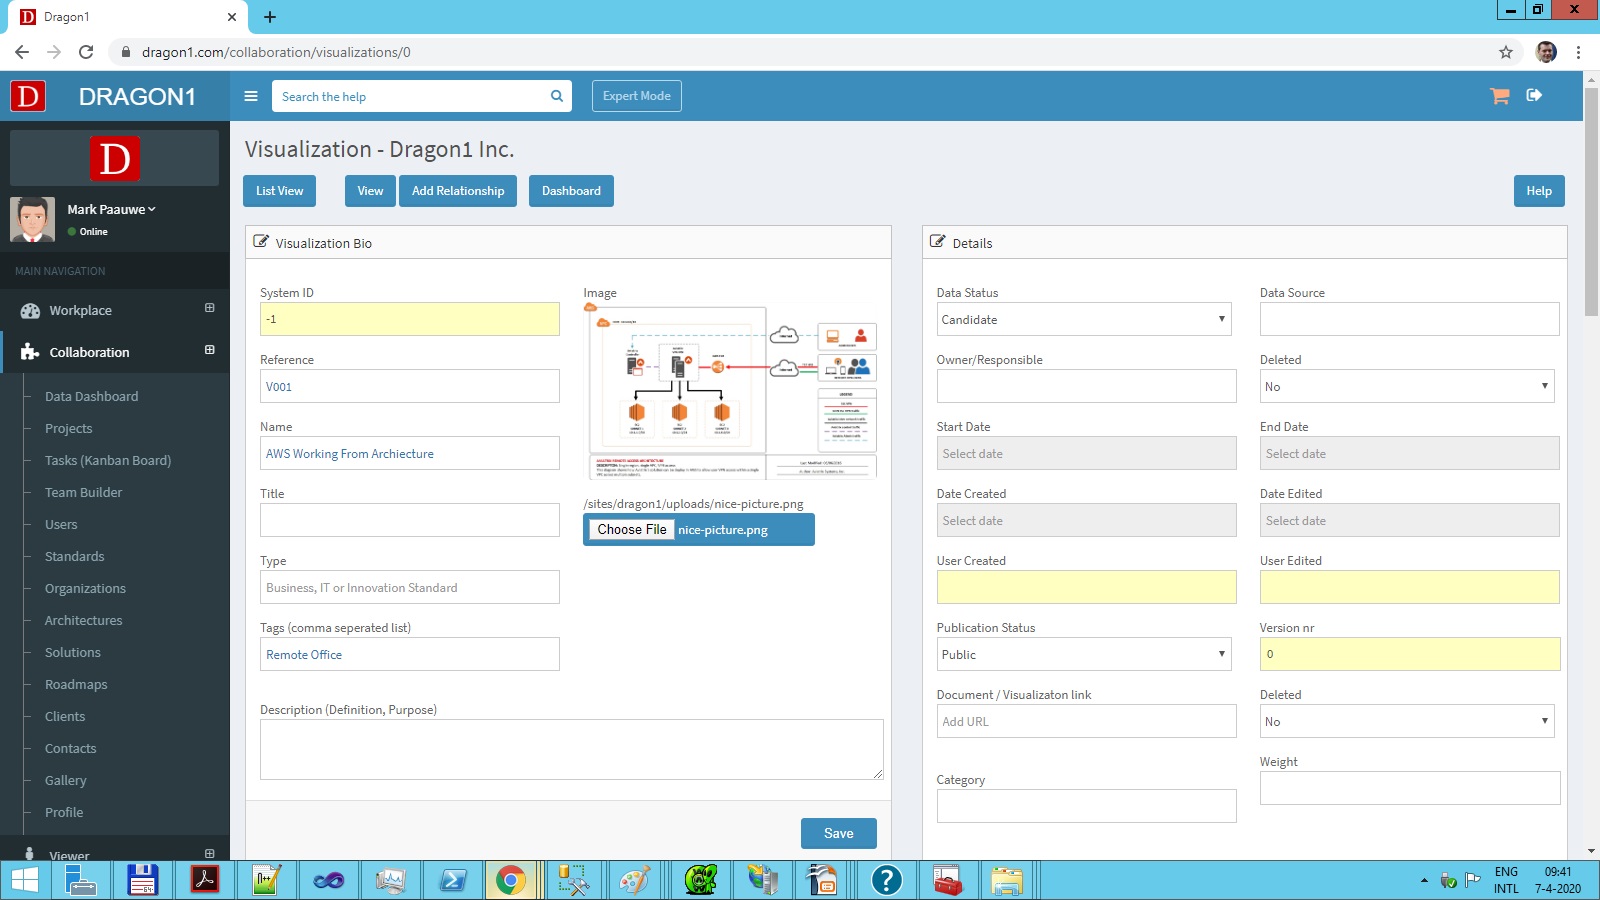
Dragon1 supports you in three ways to create or generate a visualization: via the Data Dashboard, via the Architecture Repository, and the Visual Designer. All three ways will be shown here:
How to Create a Visualization using the Data Dashboard?
To create and generate visualization:
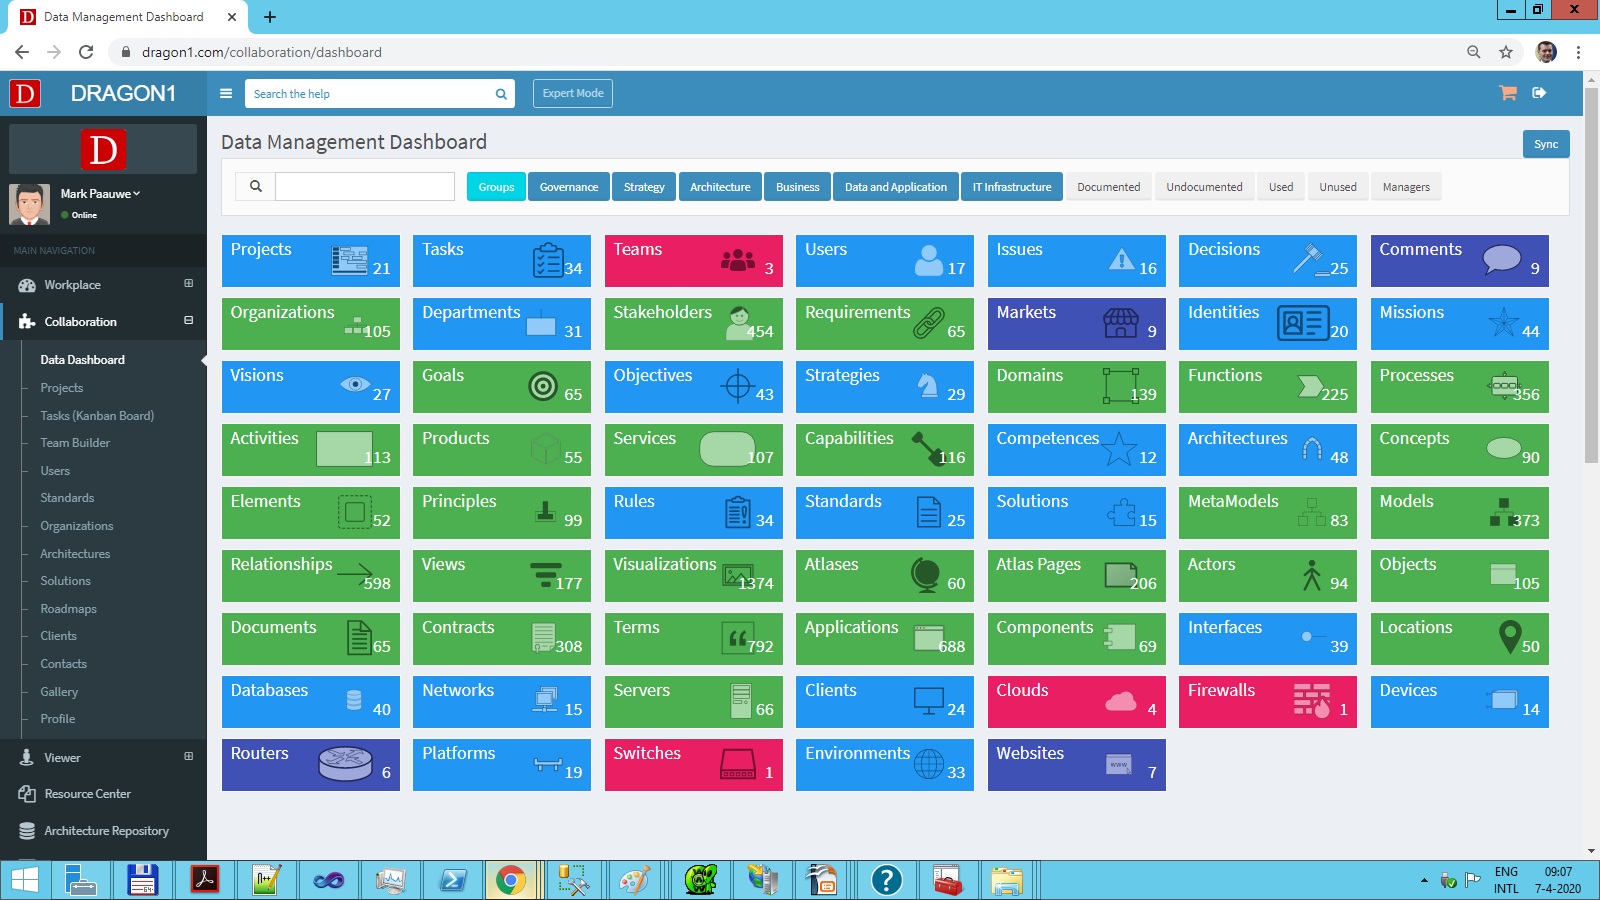
- Go to the Data Dashboard.
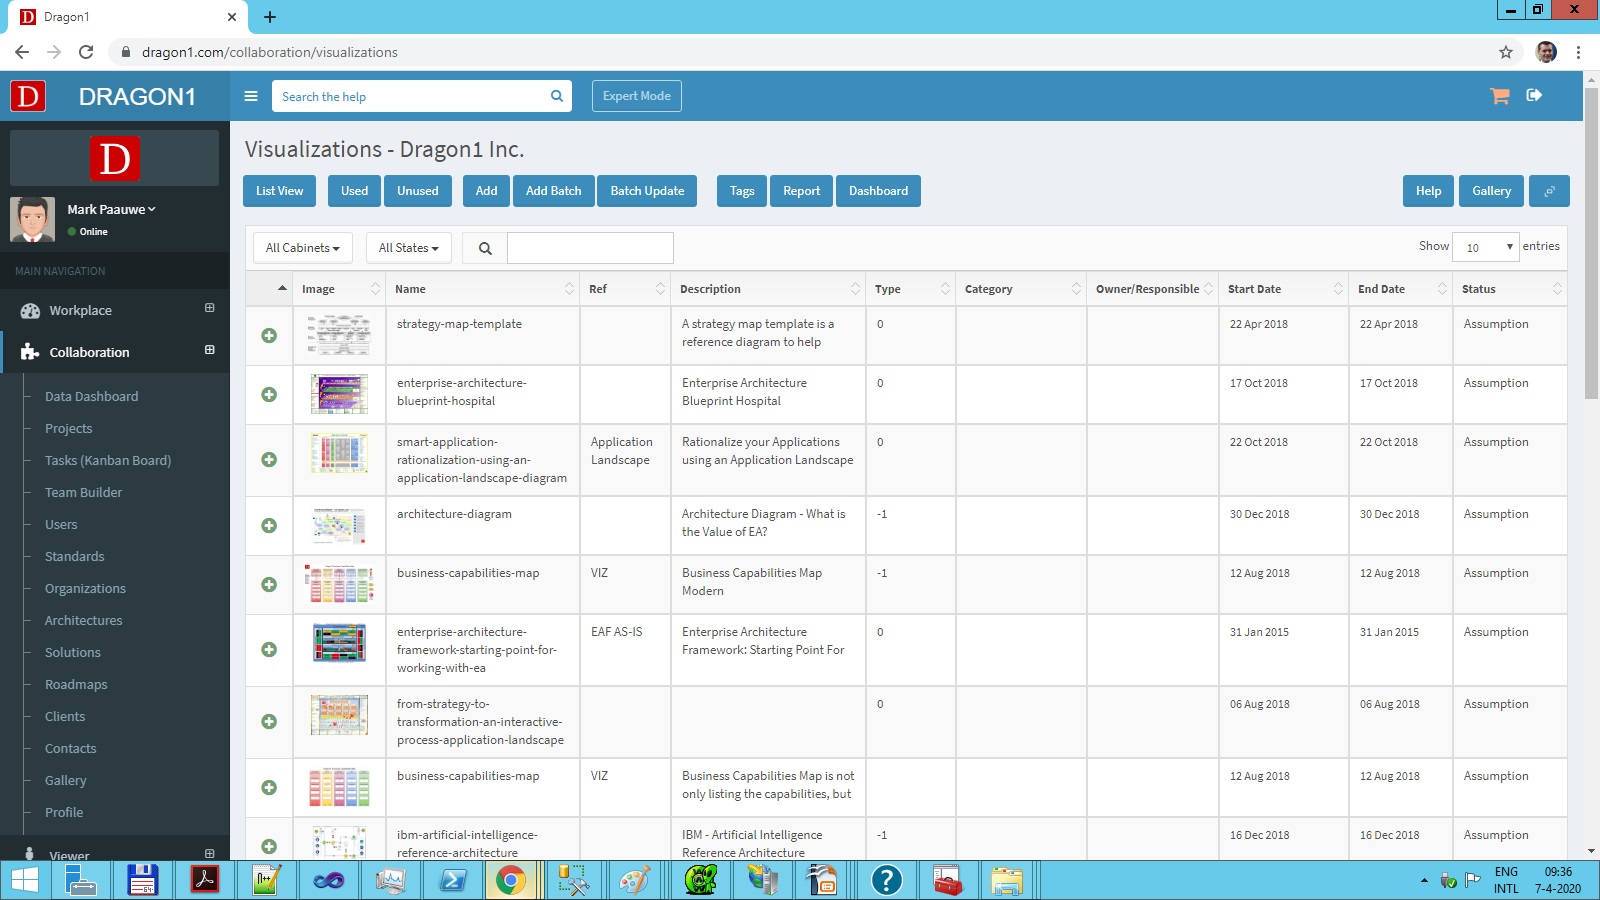
- Click on Visualizations.
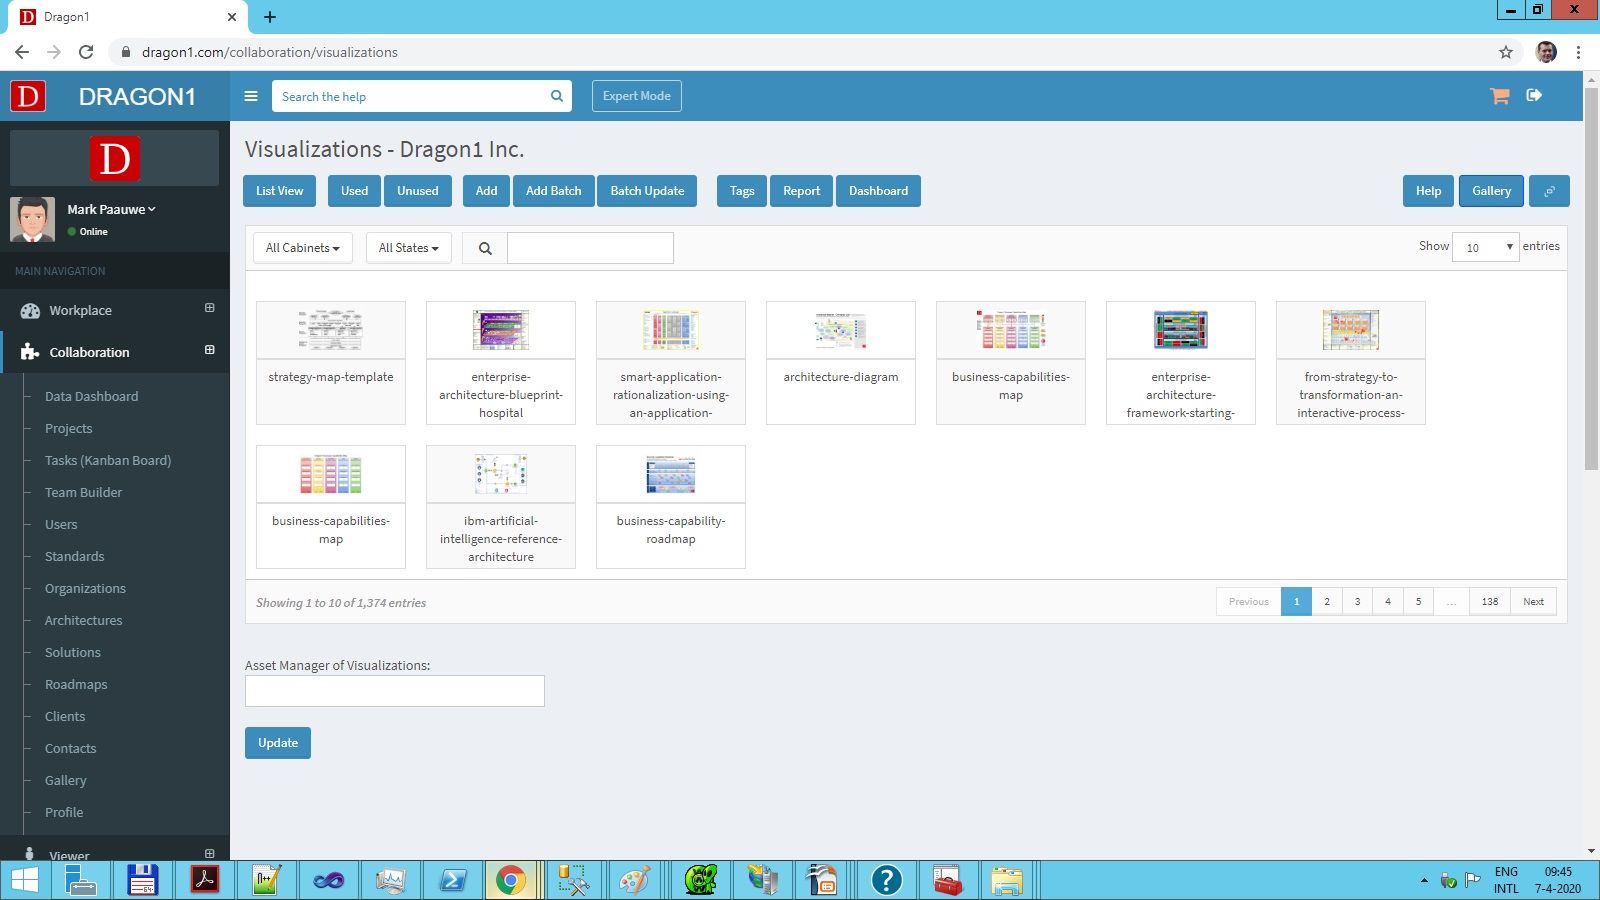
- Click the Gallery button to get a different view of the visualizations.
- Click the 'Add' button for a new Visualization.
- Enter a name and a bitmap for the visualization.
- Set 'Publication Status' to published publicly.
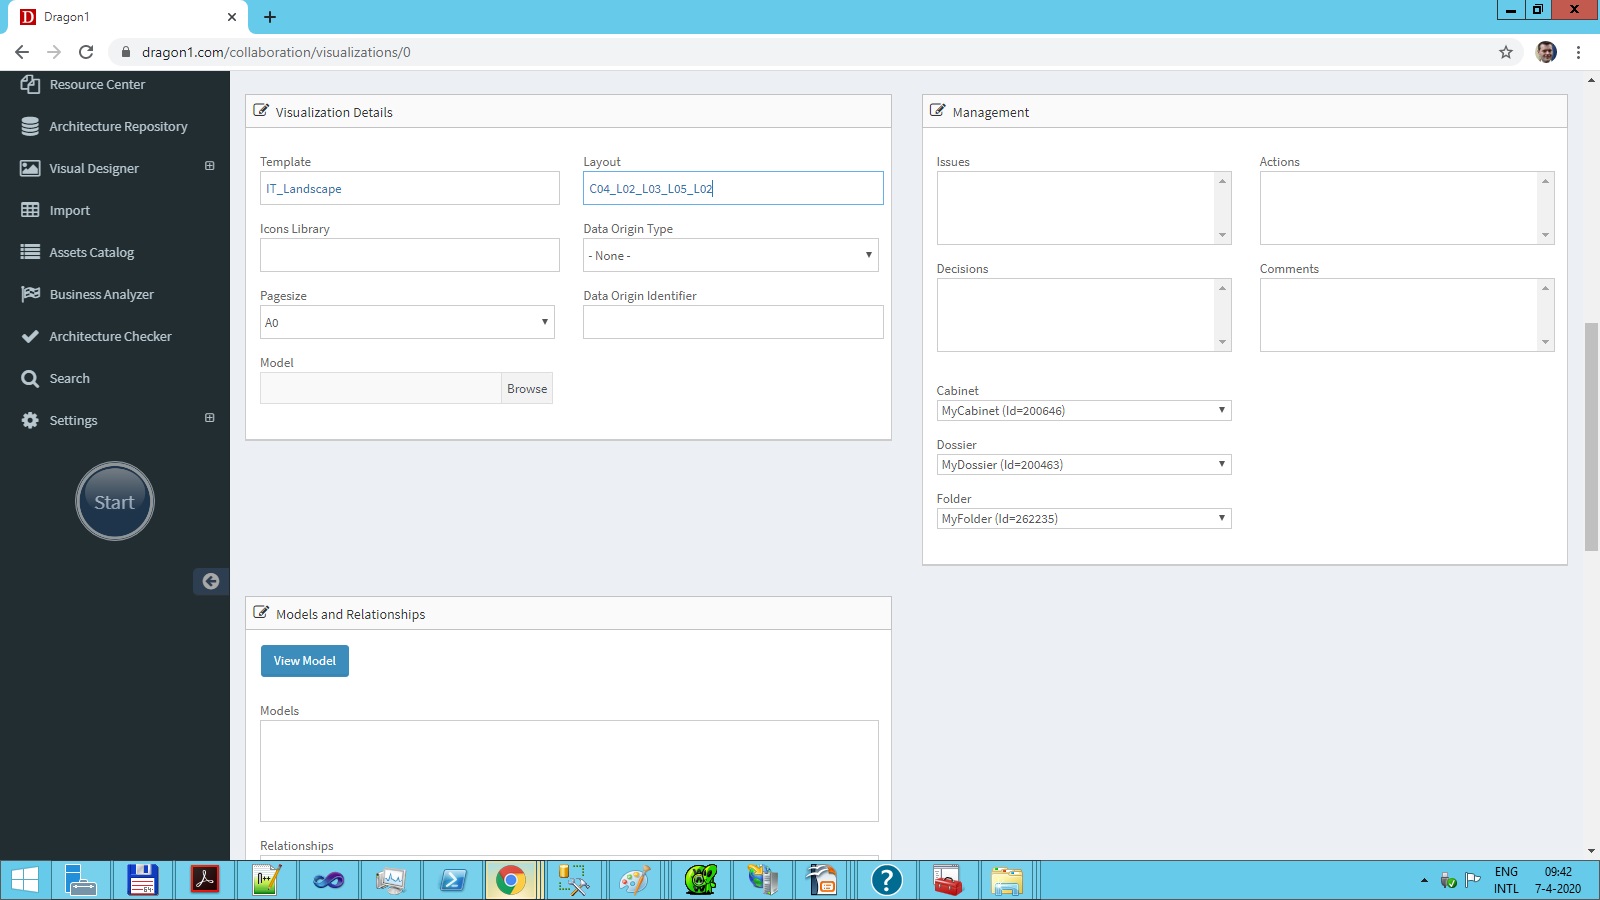
- Provide a template: Functions_Map and provide a layout: C04_L02_L03_L05_L02
- Save the visualization.
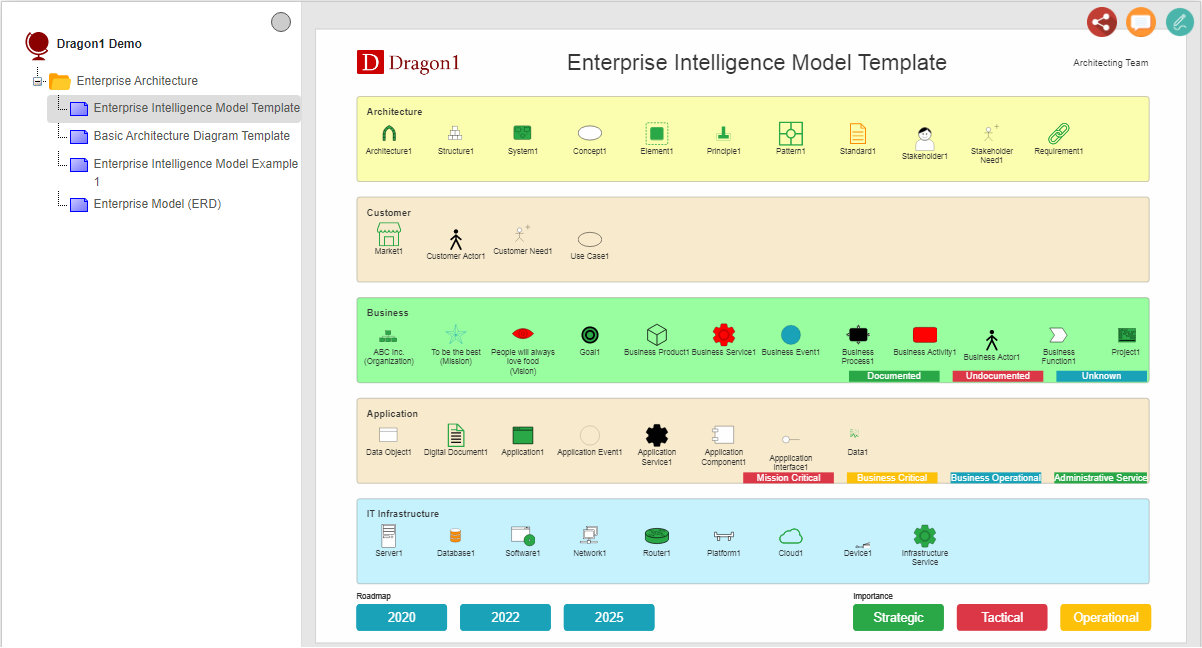
- Go to the Viewer to see the empty visualization layout published.
How to Create a Visualization using the Architecture Repository?
To create a visualization, follow the steps below:
- Log in.
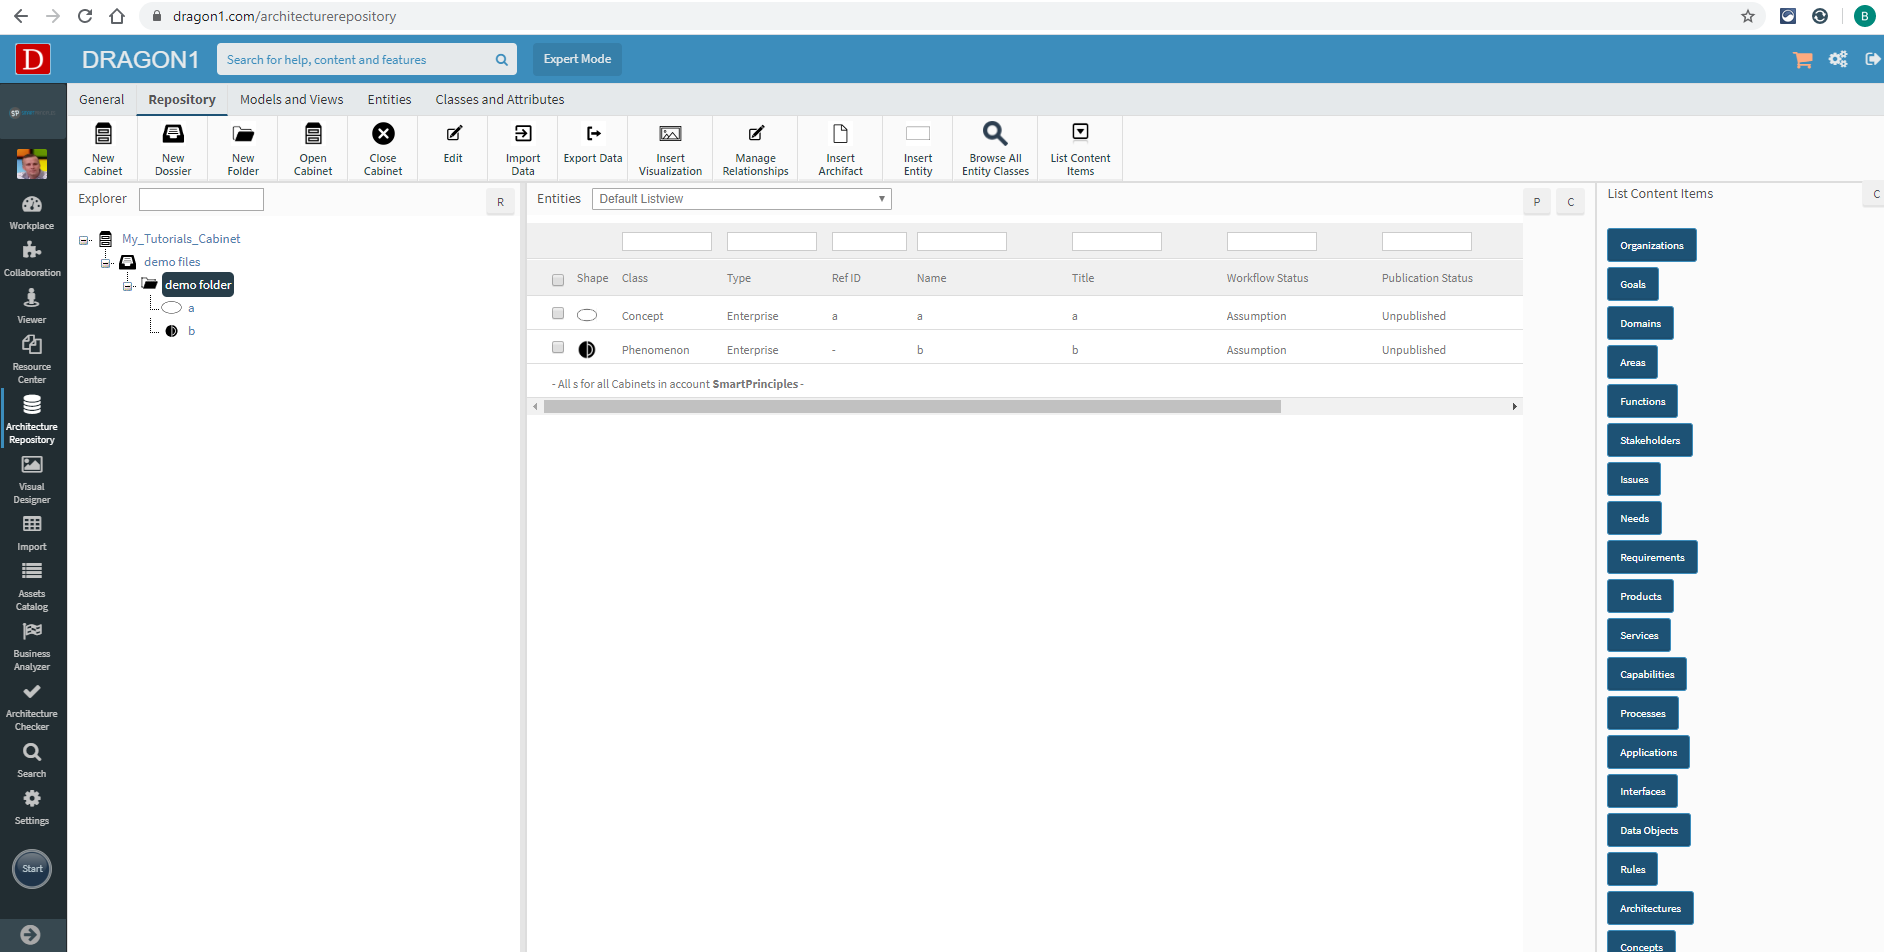
- Click 'Architecture Repository' in the left side menu.
- Click 'Open cabinet' to open a cabinet.
- In the Cabinet, navigate to the Dossier and within the Dossier to the specific Folder.
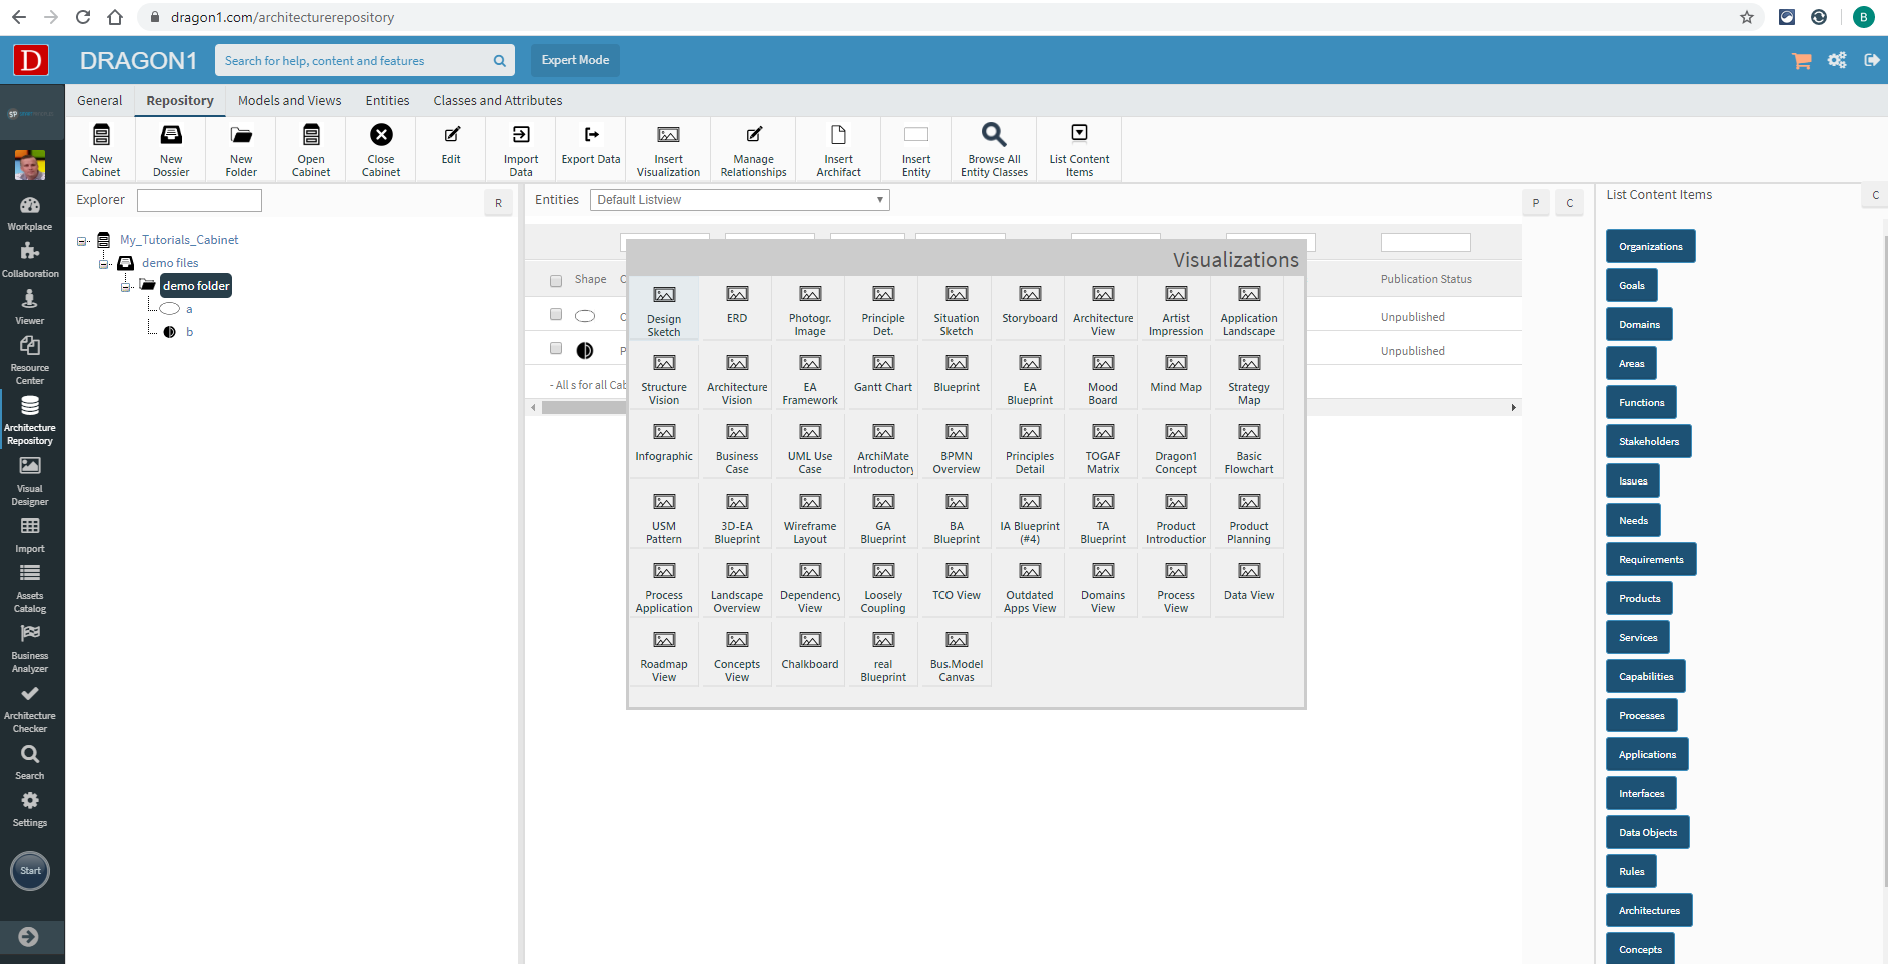
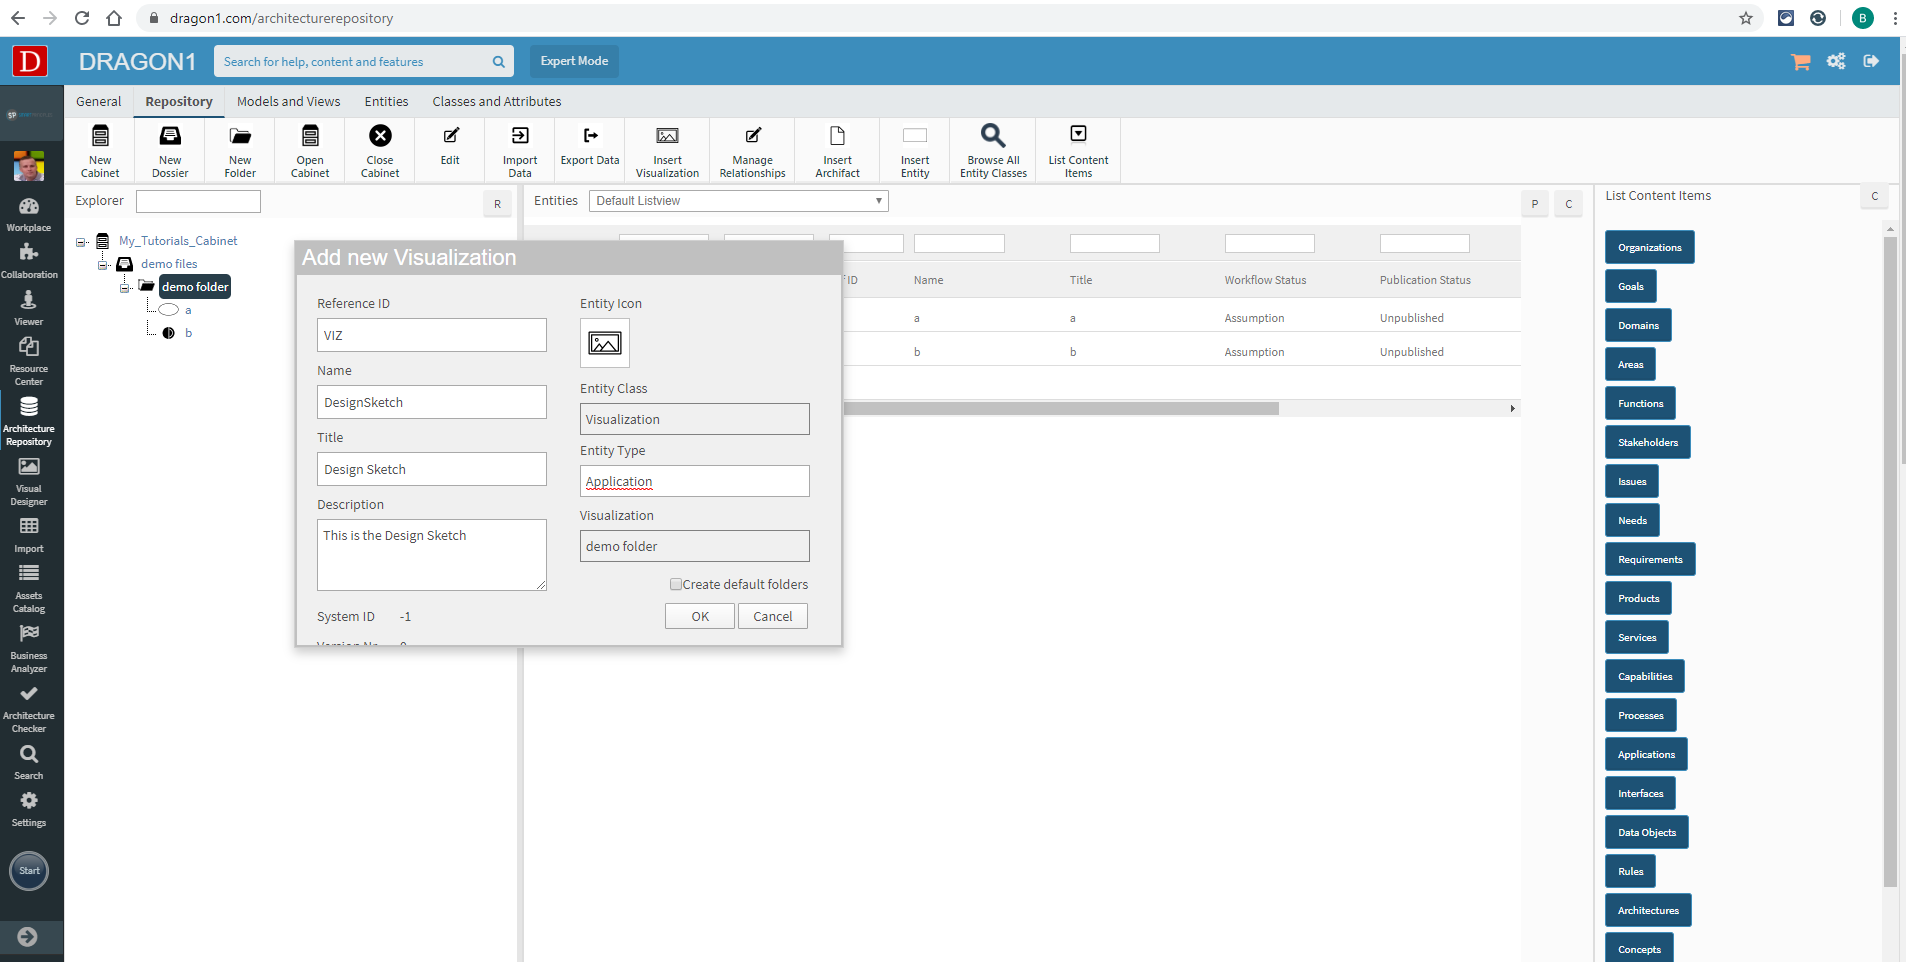
- Click the 'Insert Visualization' button in the top button bar to add a new Visualization.
- Enter the Name, Title, Description, and Entity Type (e.g., Application).
- Press the 'OK' button to add the Visualization.
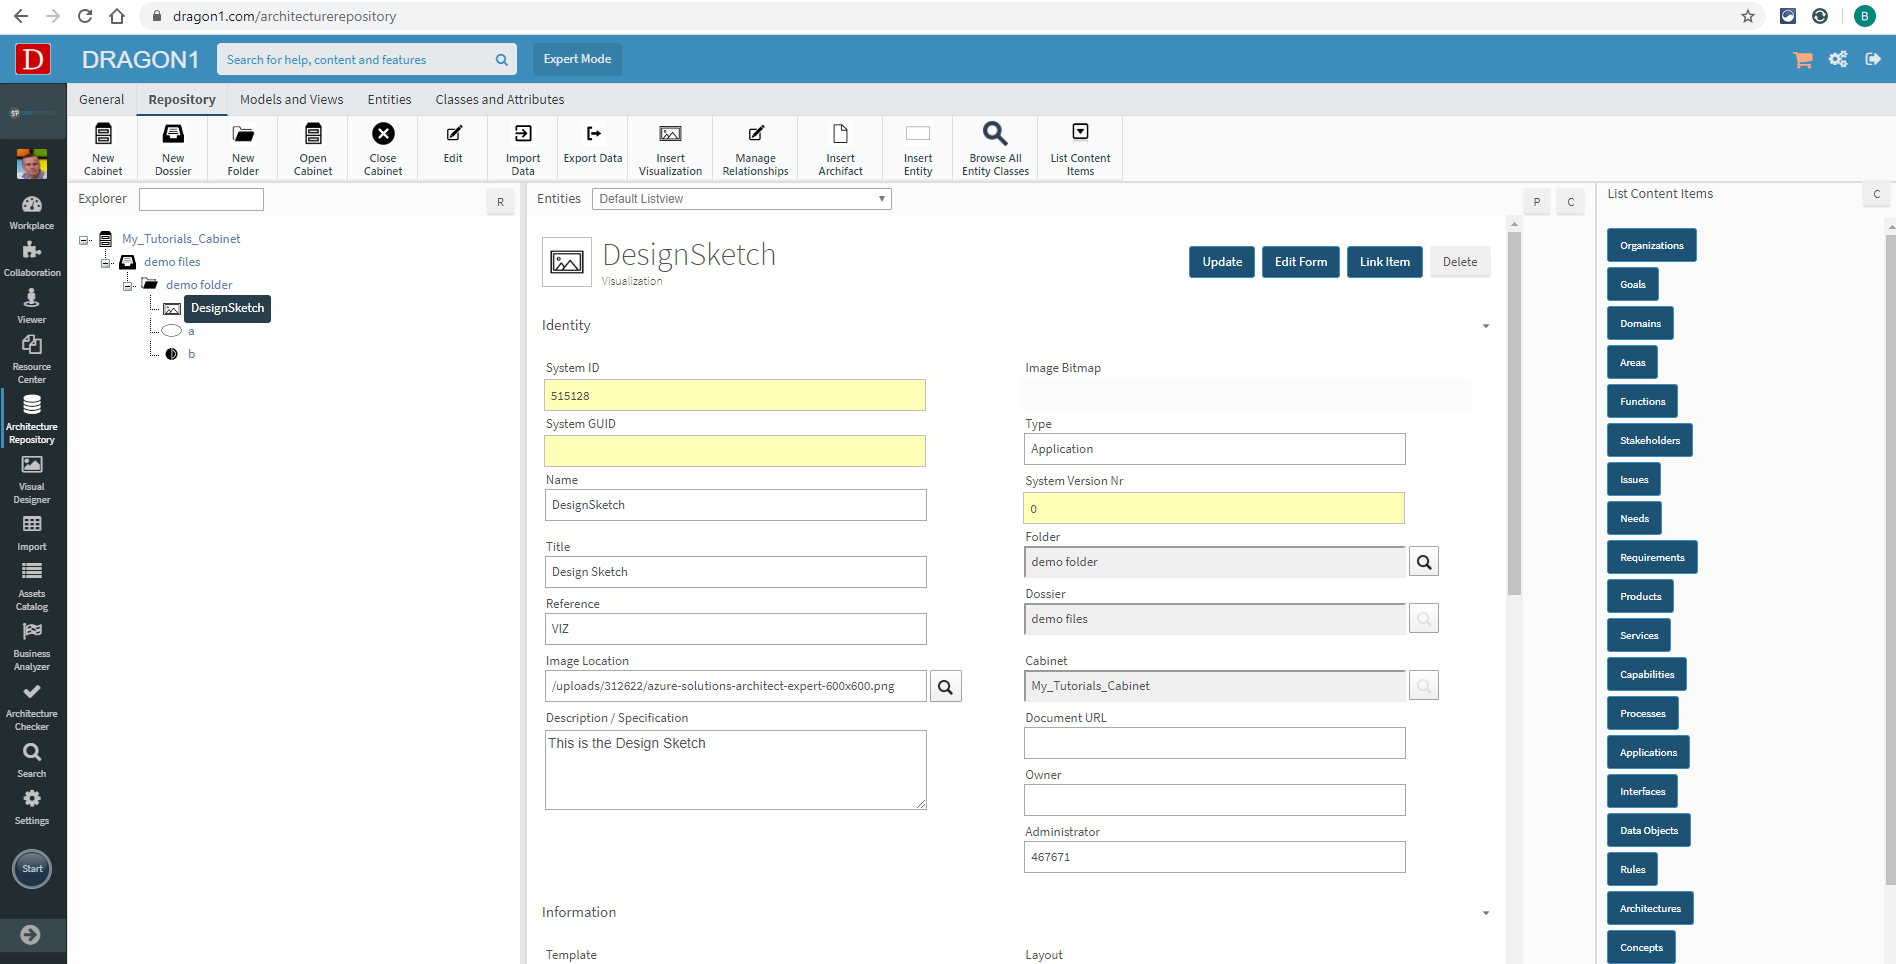
The Visualization is shown in the folder.
Visualization Description Options
You can tweak how a visualization looks easily and nicely.
Below are values that can be placed comma-separated in the description field of a visualization.
- nodetailsbutton - THIS WILL SUPPRESS THE AUTOGENERATED SHOW DETAILSDIAGRAM BUTTON.
- countitems - this will show per area the number of items in that area
- drawrelationship - the relationships between objects are drawn
- noselfrel - objects that have a self-relationship are drawn without the self-relationship.
- norelname - the relationships are visualized without label name
- noorig or nopos - objects with an origx and origy attributes are not positioned. (if you add origx and origy as attributes to an object, you can position them absolutely on a visualization)
Visualization Action Script Options
- showclasses([entityclass],[entityclass],...) - this action script will only show all classes listed, from 1 to 10 classes.
- hideclasses([entityclass],[entityclass],...) - this action script will hide all classes listed, from 1 to 10 classes.
- include([entityclass],[tagsvalue]) - this action script will consist of all classes that are tagged with a specific value on to the visualization. The objects will be placed in the indicated group or at the provided origx,origy position. Example: include(Application,Show). This will show all applications that are labeled Show in the tag on a visualization.
- noautoscan - this will cancel the autoscan for the visualization
Layout options for the Canvas and Templates
Visualizations have an easy way of configuring the layout of the canvas and templates.
The layout can be specified in the layout field of a Visualization data entity in the collaboration application.
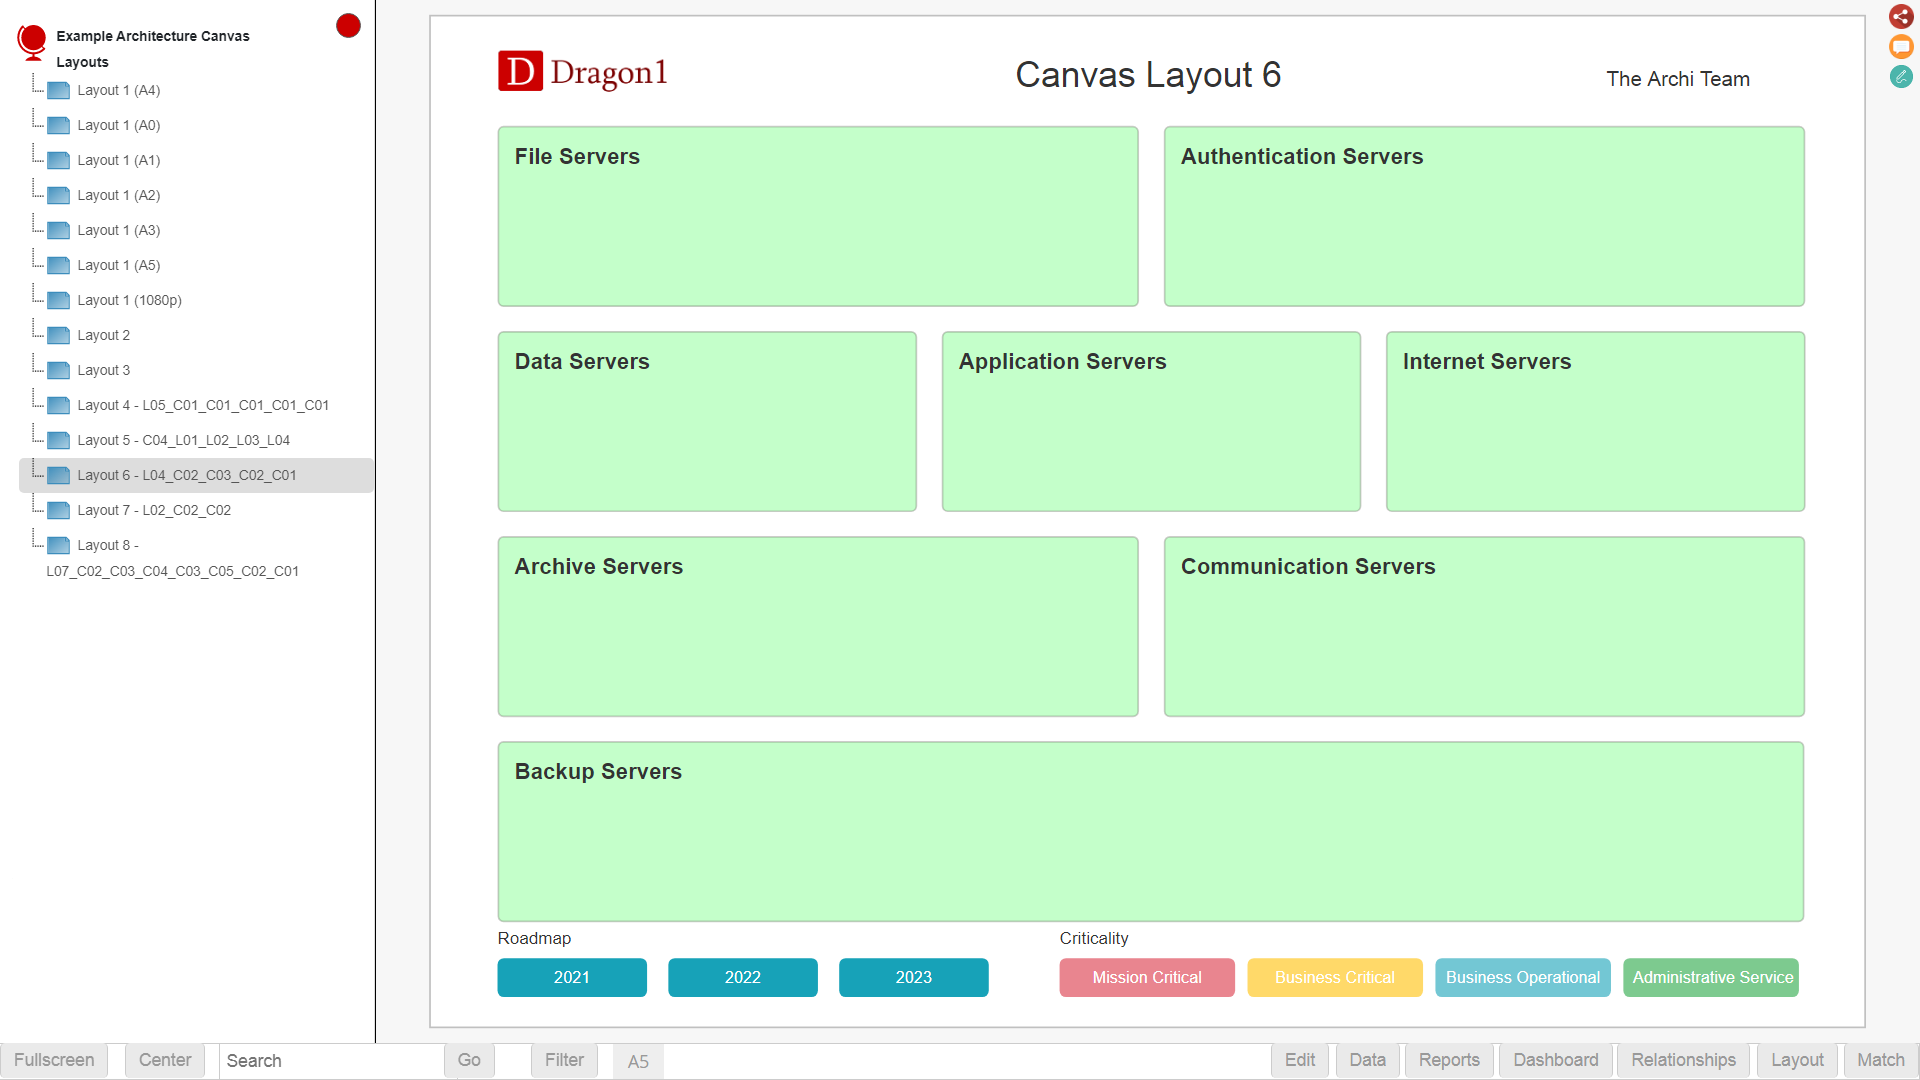
Suppose you want to create a visualization that shows one big area; this is, in fact, 1 layer with 1 column. You can specify that like: "L01_C01" or "C01_L01".
L = Layer. C = Column. L01 is 1 layer. C01 is 1 column.
Suppose you want to create a visualization with 4 layers, with 2 columns in the first layer, 1 column in the 2nd layer, 3 columns in the 3rd layer, and 1 column in the bottom layer. You can specify that like: L04_C02_C01_C03_C01.
Suppose you want to create a visualization with four columns, with 2 layers in the first column, 1 layer in the 2nd column, 3 layers in the 3rd layer, and 1 layer in the right column. You can specify that like: C04_L02_L01_L03_L01.
To give a group a name, enter a comma-separated list of names in the Group field.
You can mix layers with columns. This layout string generates 2 columns at the right of 3 layers: L03_C1_C01_C01_R02.
This layout string generates 1 column at the left and 2 columns at the right of 3 layers: L03_C1_C01_C01_FB01_R02.
We recommend to use R01, R02, R03 or R04 and F01, F02, F03 or F04.
Auto Layout Options
Dragon1 currently supports 1 auto layout option: Hierarchy
If you provide this value in the Layout field then Dragon1 will auto layout your diagrams. Multiple rootnodes are supported.
Layout Extensions
A Layout Ext field is next to the layout field.
In this field, you can specify subgroups in groups.
Suppose you want 2 subgroups in each of the 8 groups on your diagram. You can specify this like: S02_S02_S02_S02_S02_S02_S02_S02.
To give a group a name, enter a comma-separated list of names in the Sub Groups field.
Create Button Bars
To create and configure new button bars or hide the default button bars on a visualization, read the create button bar help page.
How to Create and Generate a Visualization using the Visual Designer
To insert a Visualization, follow the steps below:
- Log in.
- Click 'Visual Designer' in the left side menu.
- Click 'Open cabinet' to open a cabinet.
- In the Cabinet, navigate to the Dossier and within the Dossier to the specific Folder.
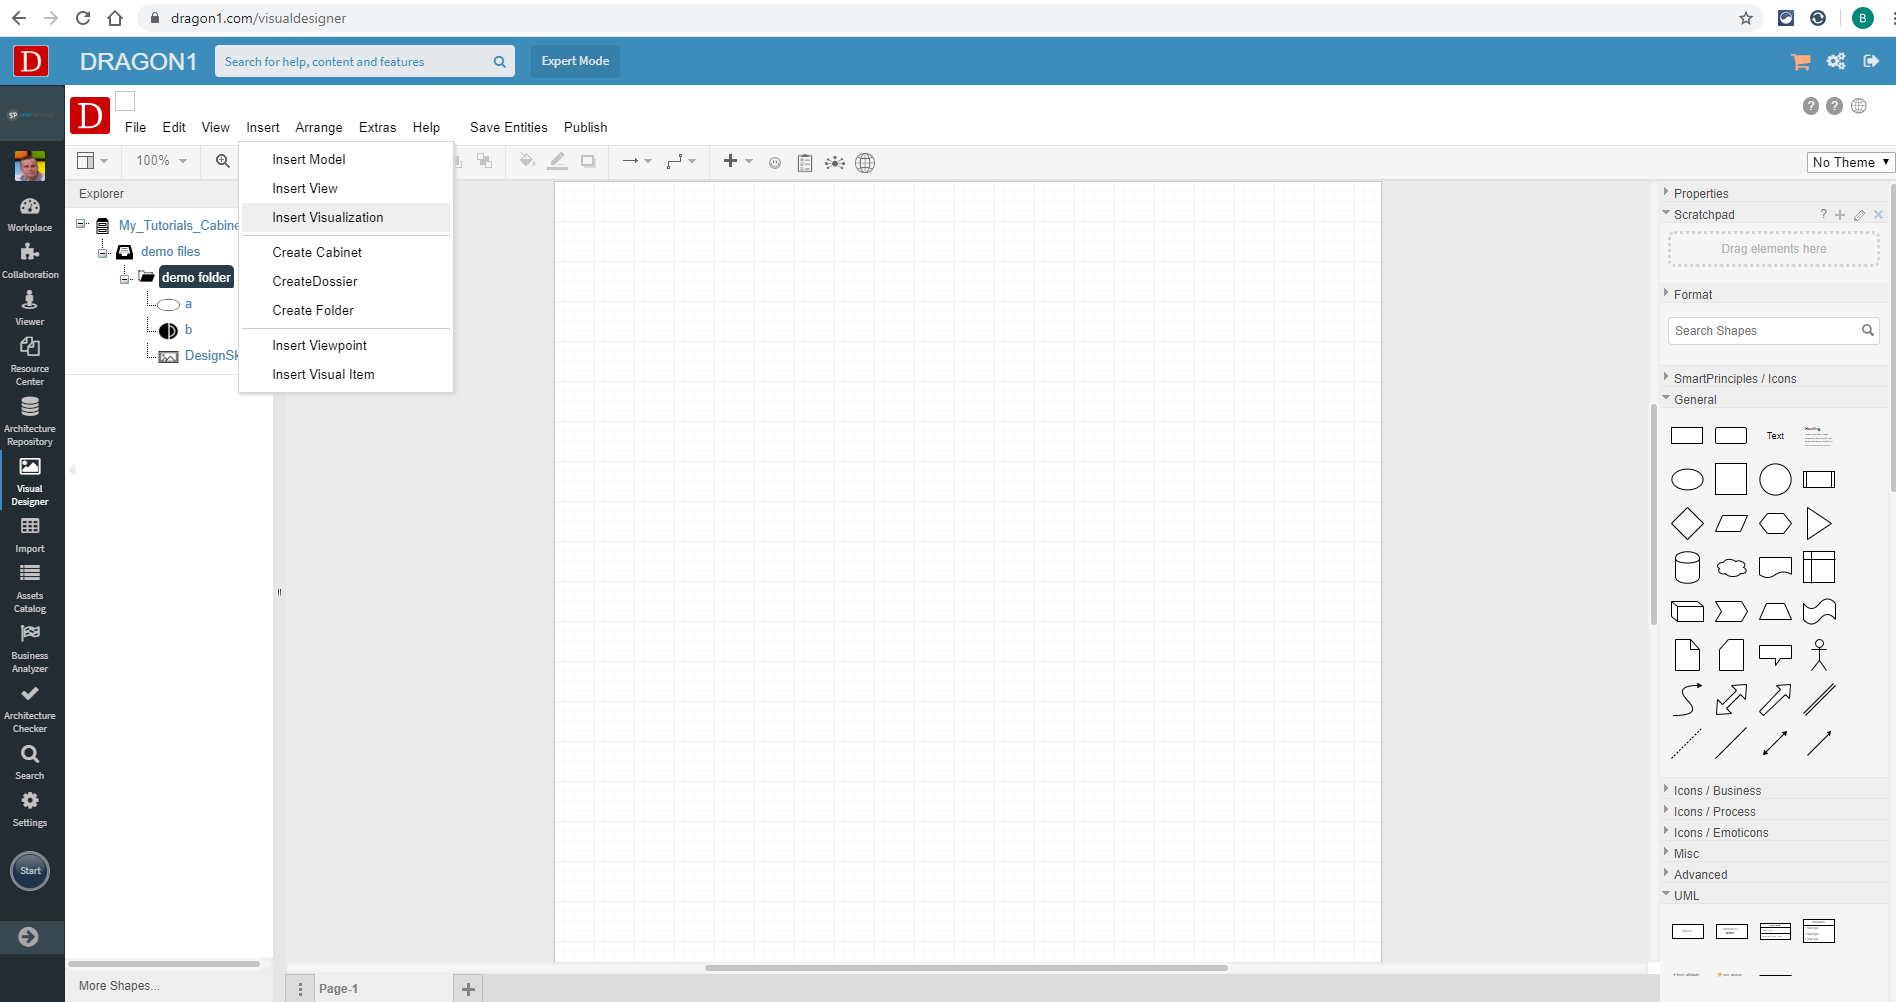
- Click 'Insert' on the menu bar to open the pulldown menu.
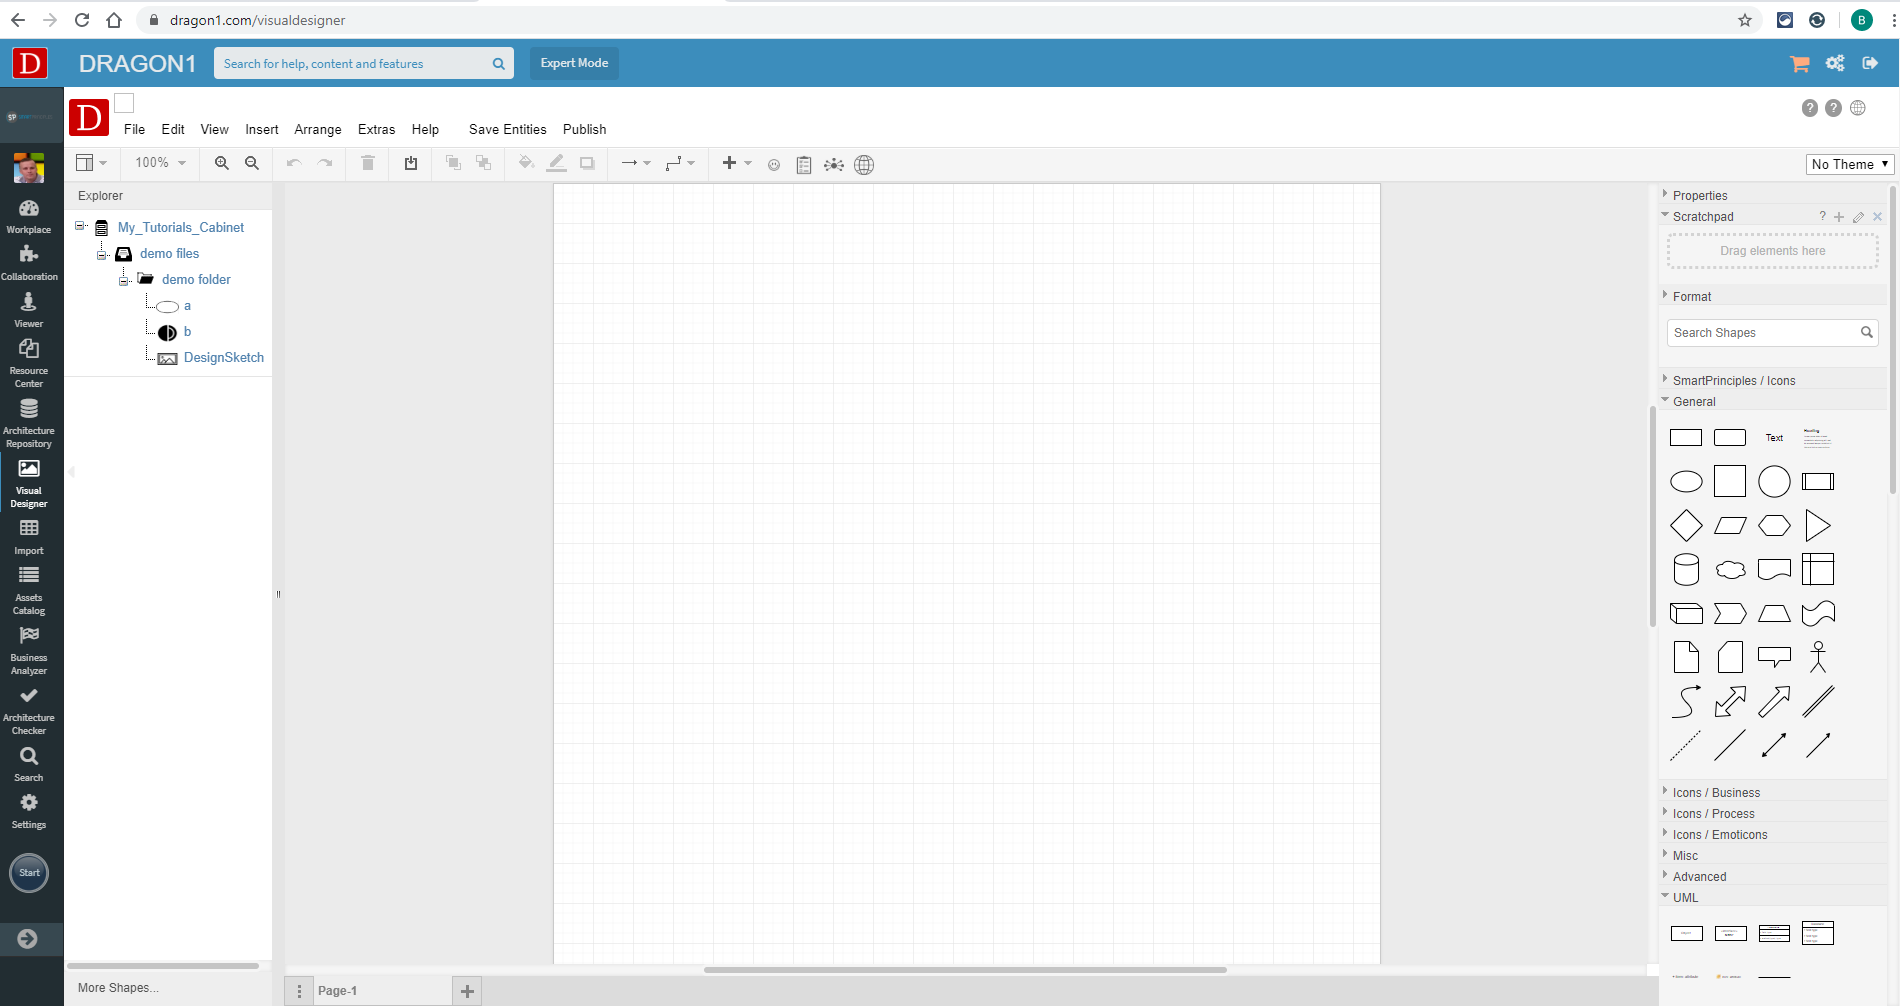
- Click 'Insert Visualization' in the menu to add a new Visualization.
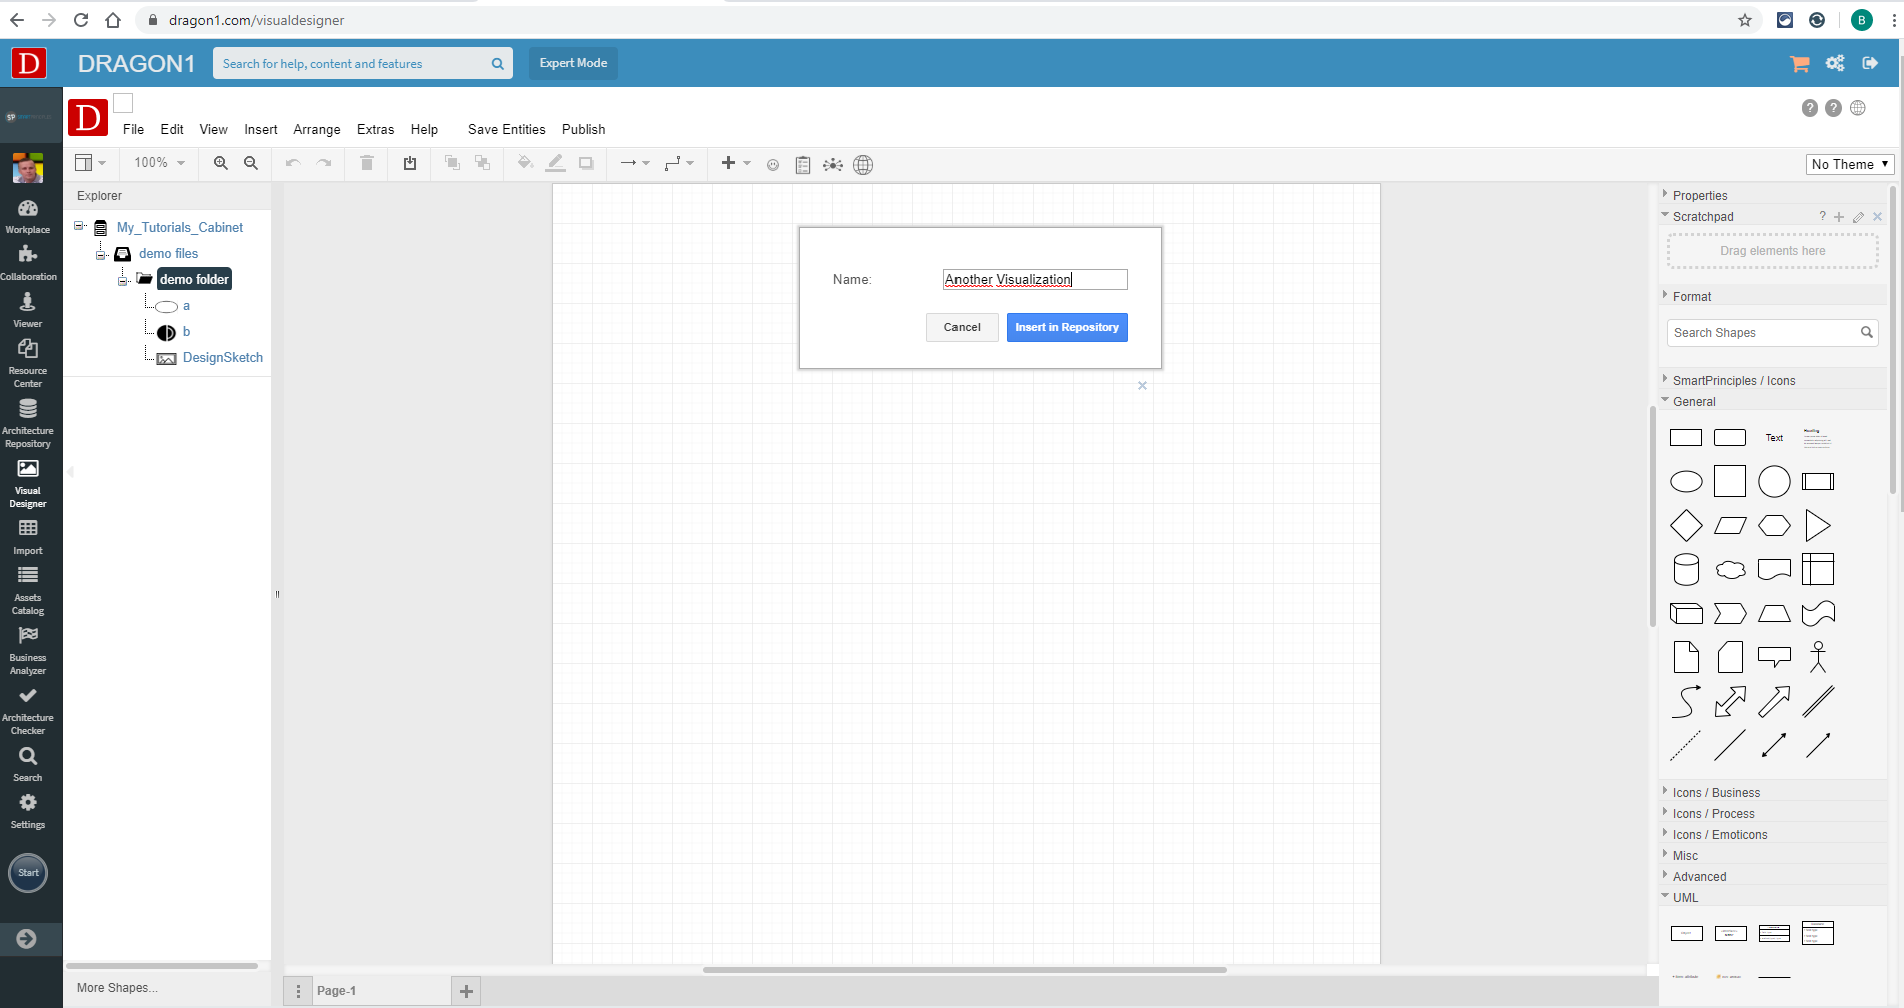
- Enter the Name of the visualization.
- Press the 'Insert' button to add the Visualization.
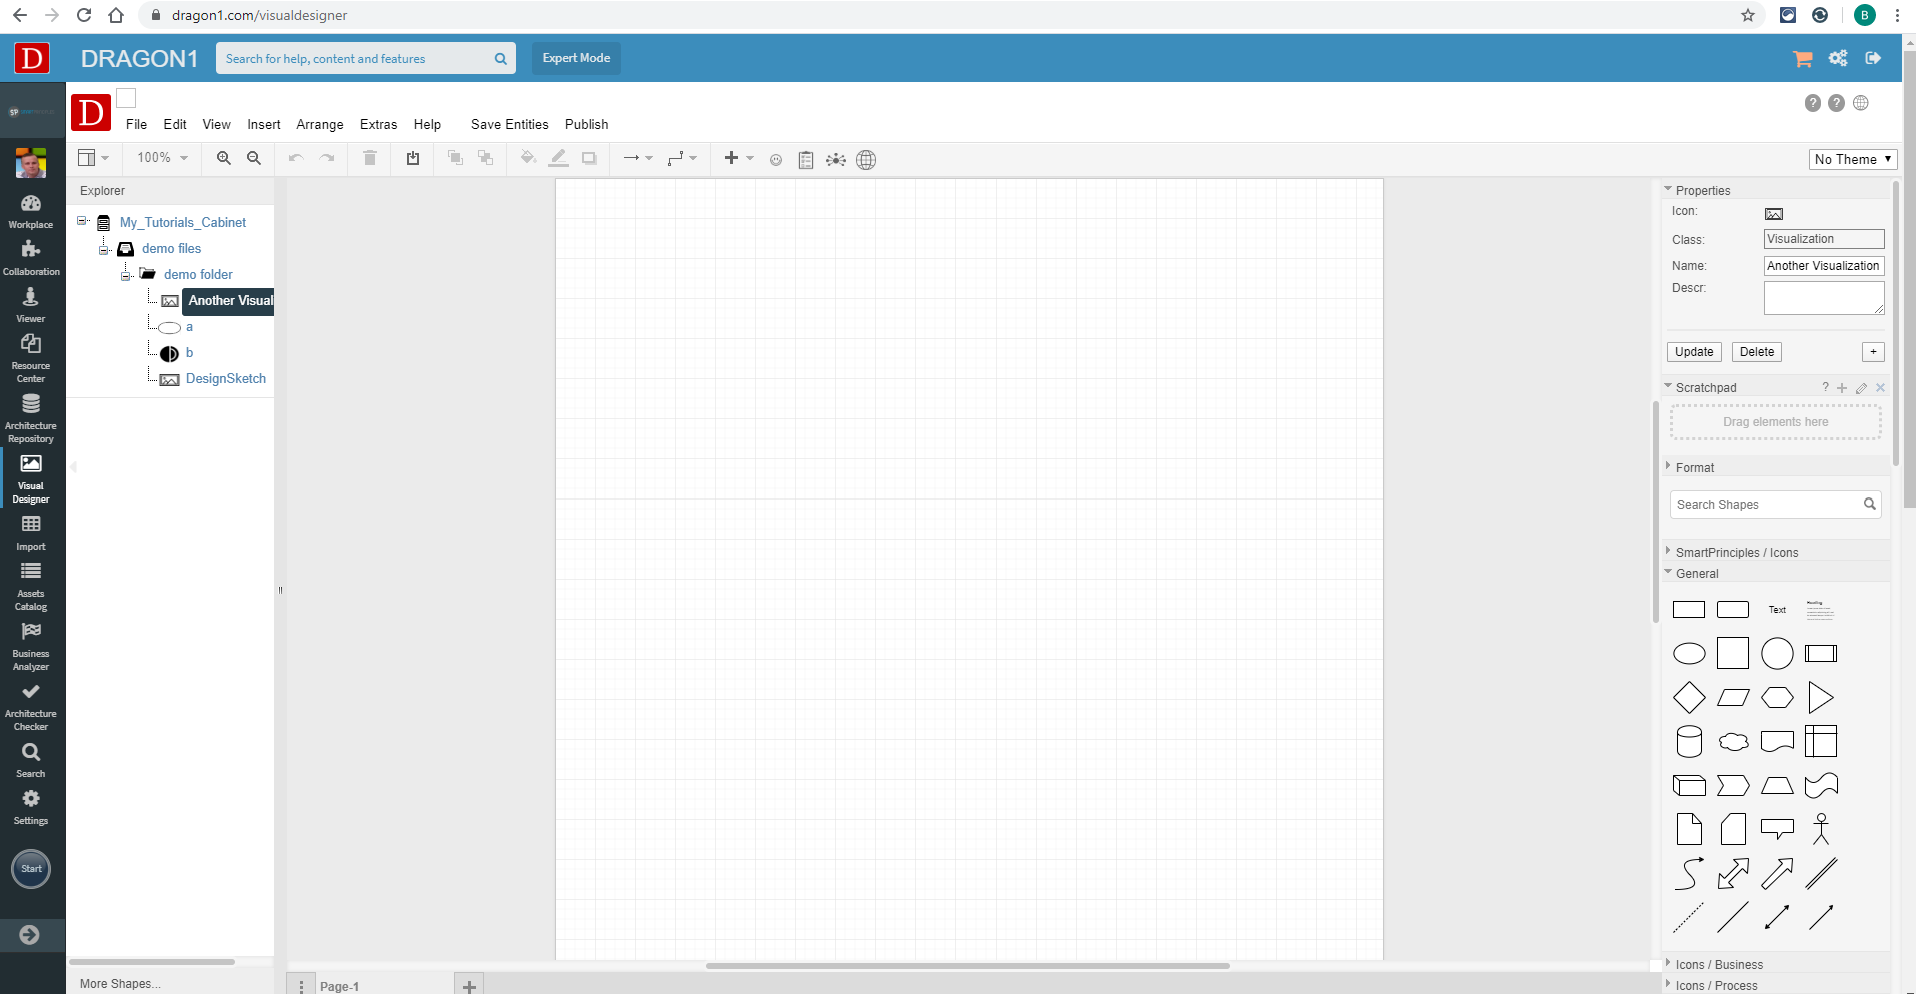
The Visualization is added to the folder. In the right menu bar, a few Visualization properties can be set. To get access to the complete set of properties, the Visualization has to be opened using the Data Dashboard or the Architecture Repository.
Hiding an Visualization
To hide a visualization, you can do the following:
- Go to the data dashboard
- Select visualizations
- Select your visualization
- Set the visualization to deleted
- Set the visualization to hidden
- Set the visualization to unpublished

