Create A Static Visualization
How to create a Static Visualization
On Dragon1, creating a visualization is easy. It involves a few basic steps. Once you know these steps, you can control anything you want to do.
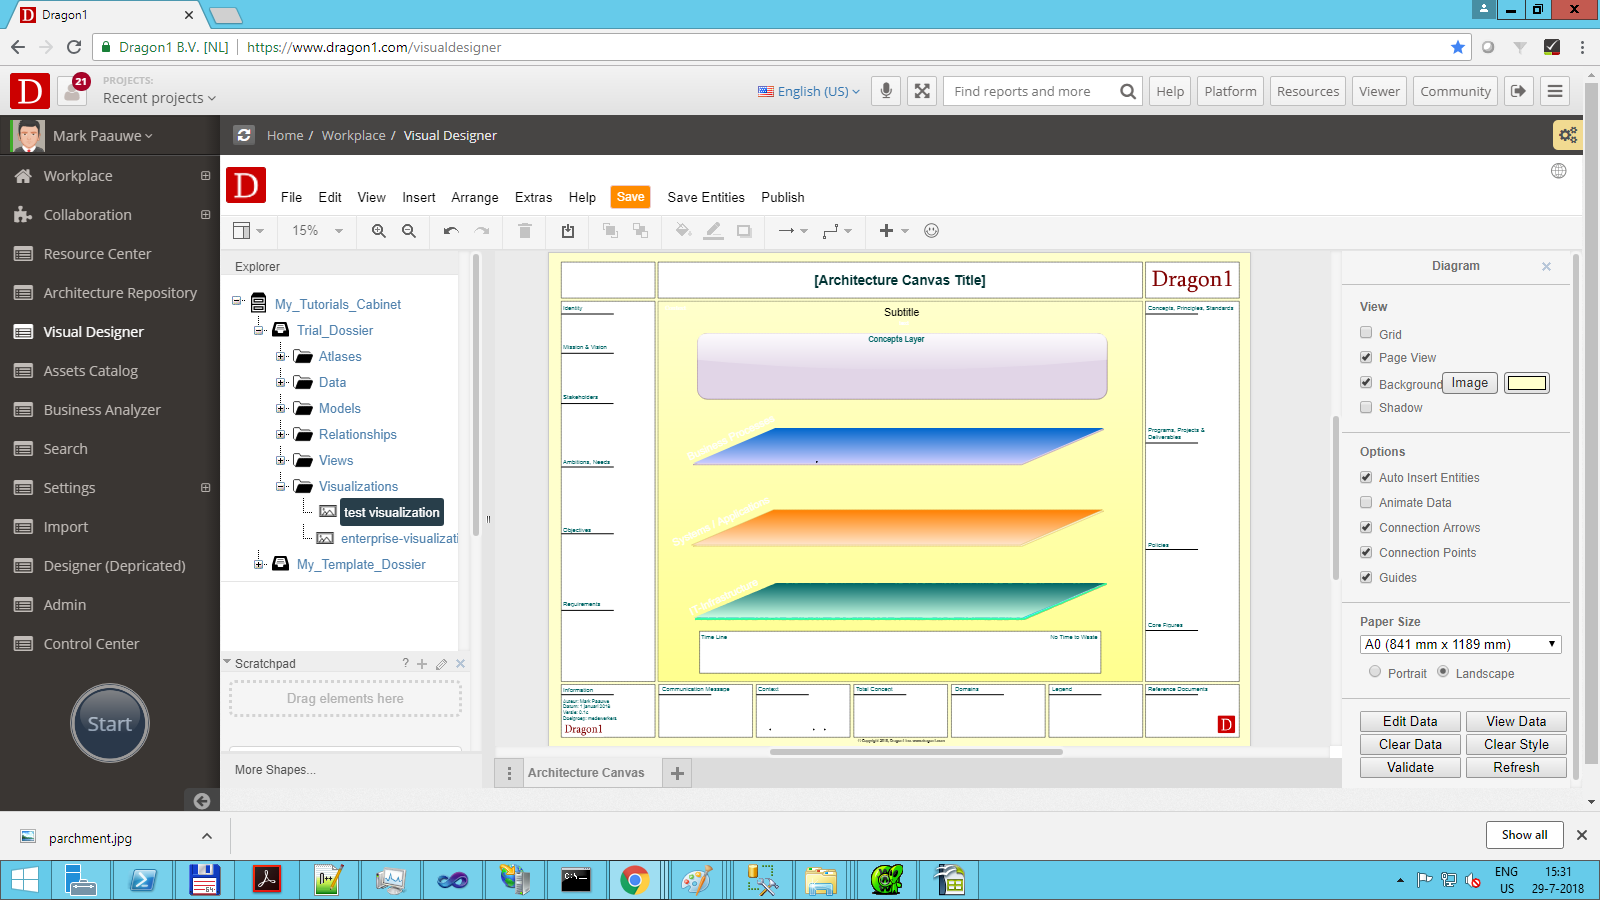
Here, we will create a static visualization using a template. A static visualization is a visualization without underlying data, models, or views.
This visualization will still be interactive (clickable) if you provide information on the title, description, and images for the entity classes/shapes on the visualization.
To create a static visualization:
- Login to Dragon1 via www.dragon1.com/login
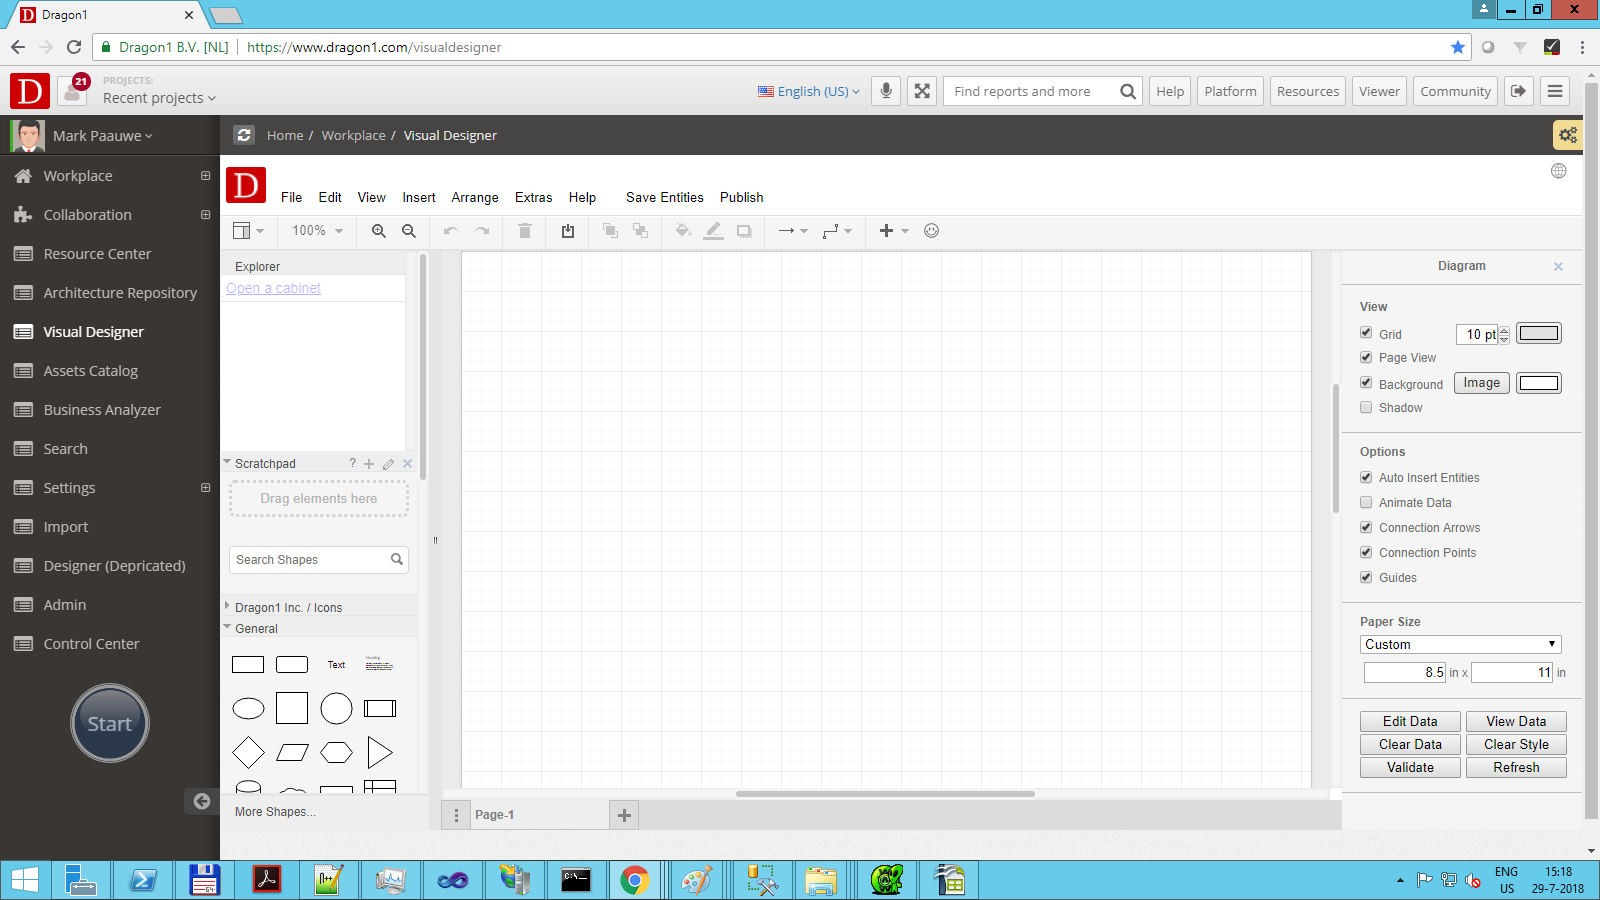
- Click on Visual Designer in the menu on the left
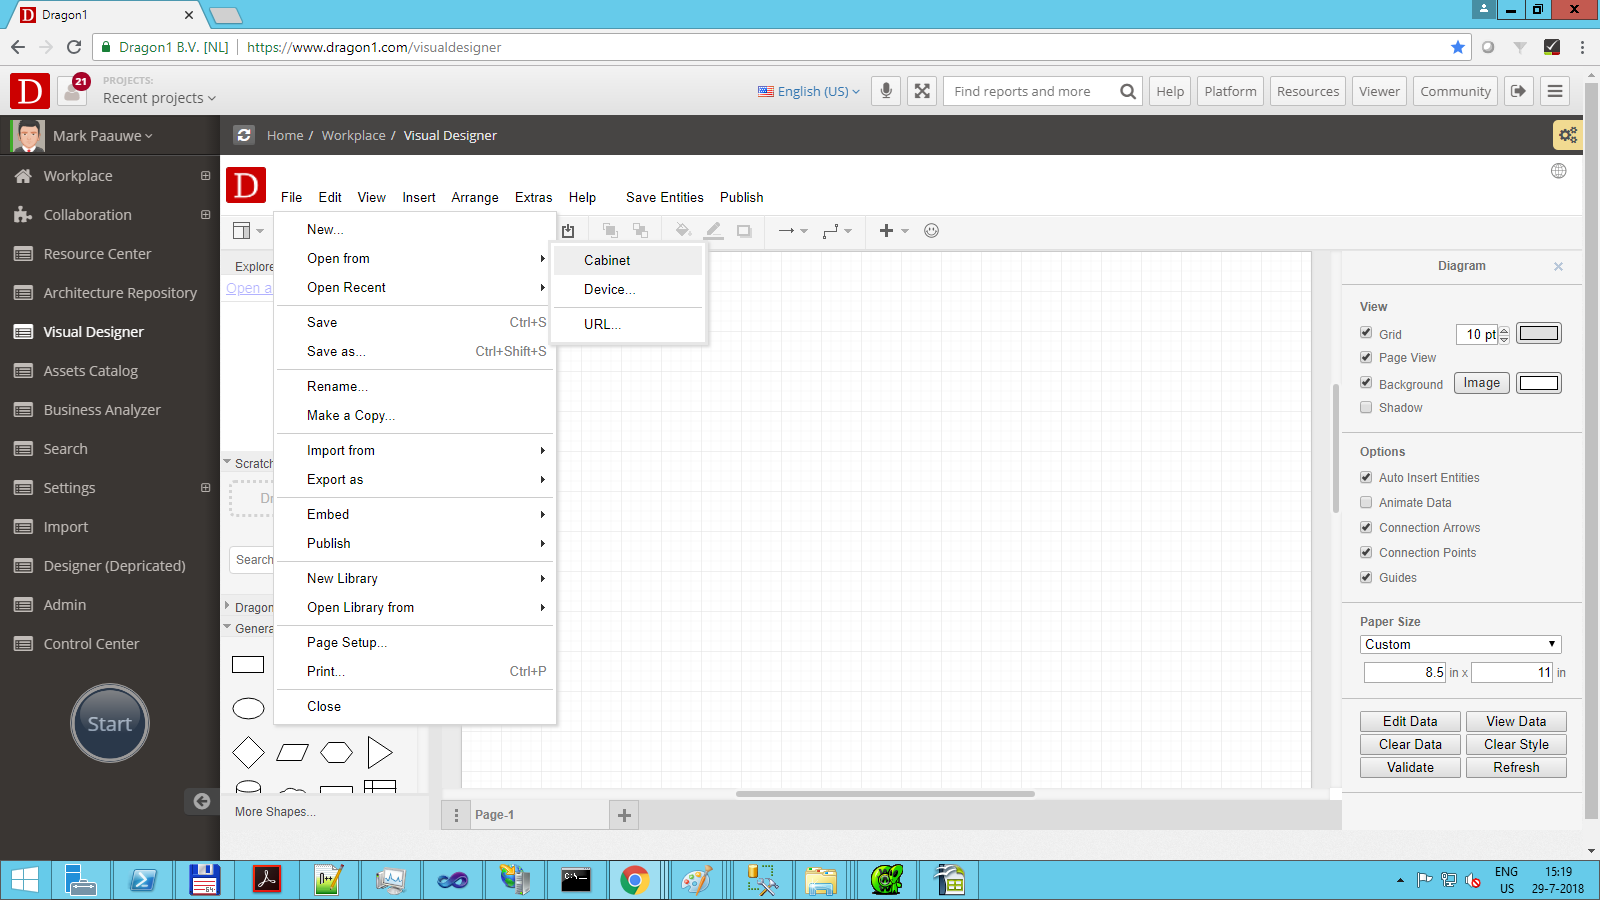
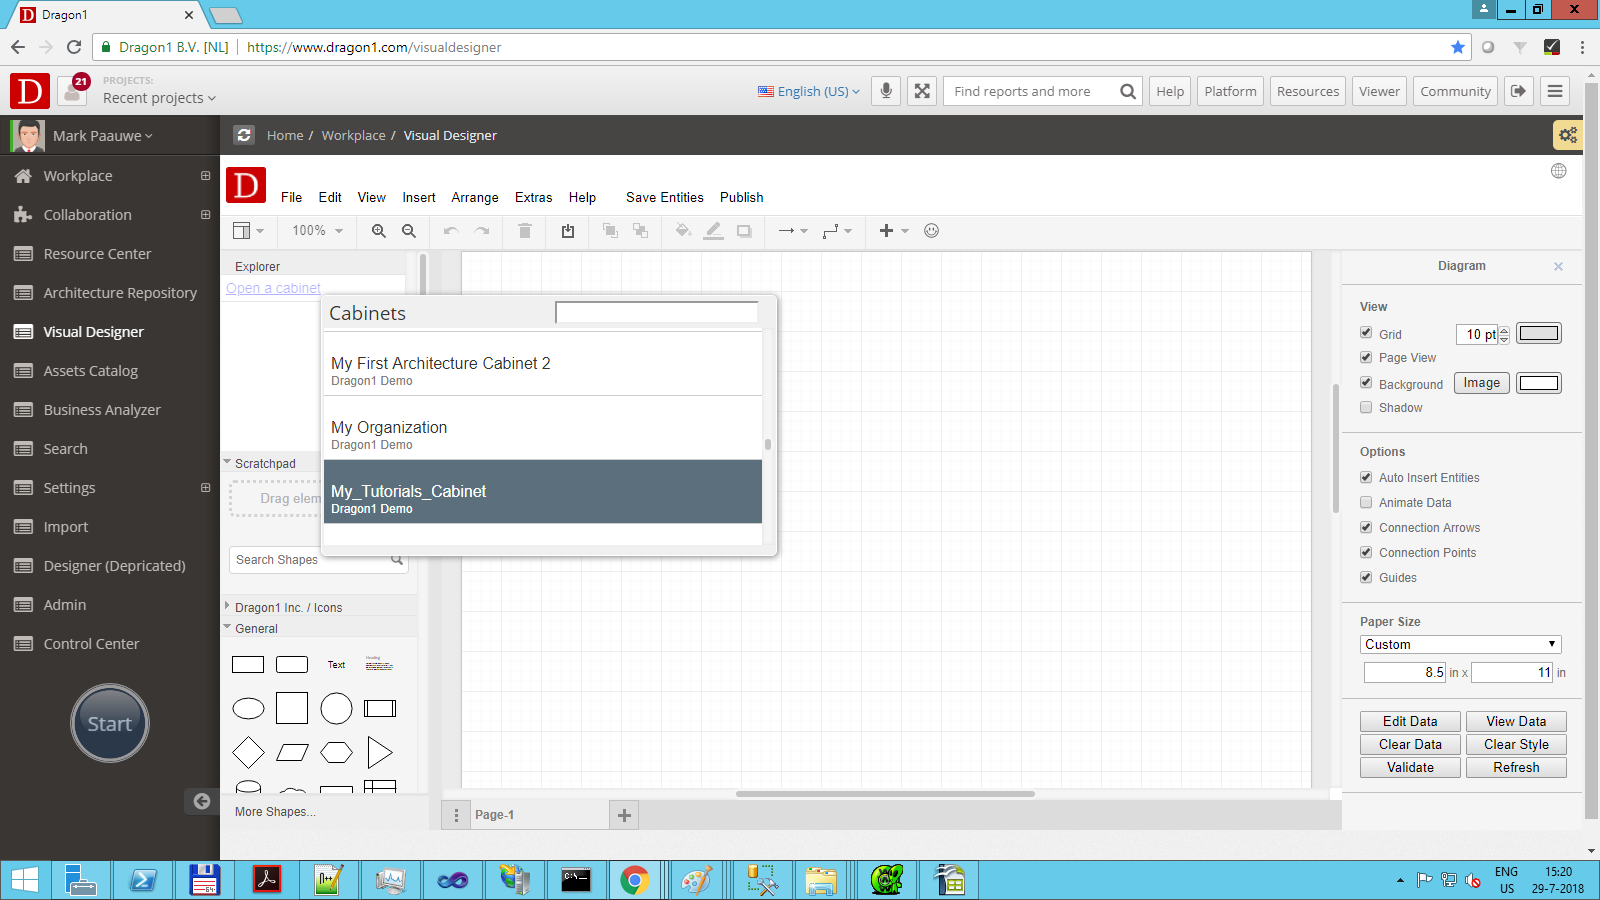
- Open an existing cabinet via File --> Open From --> Cabinet
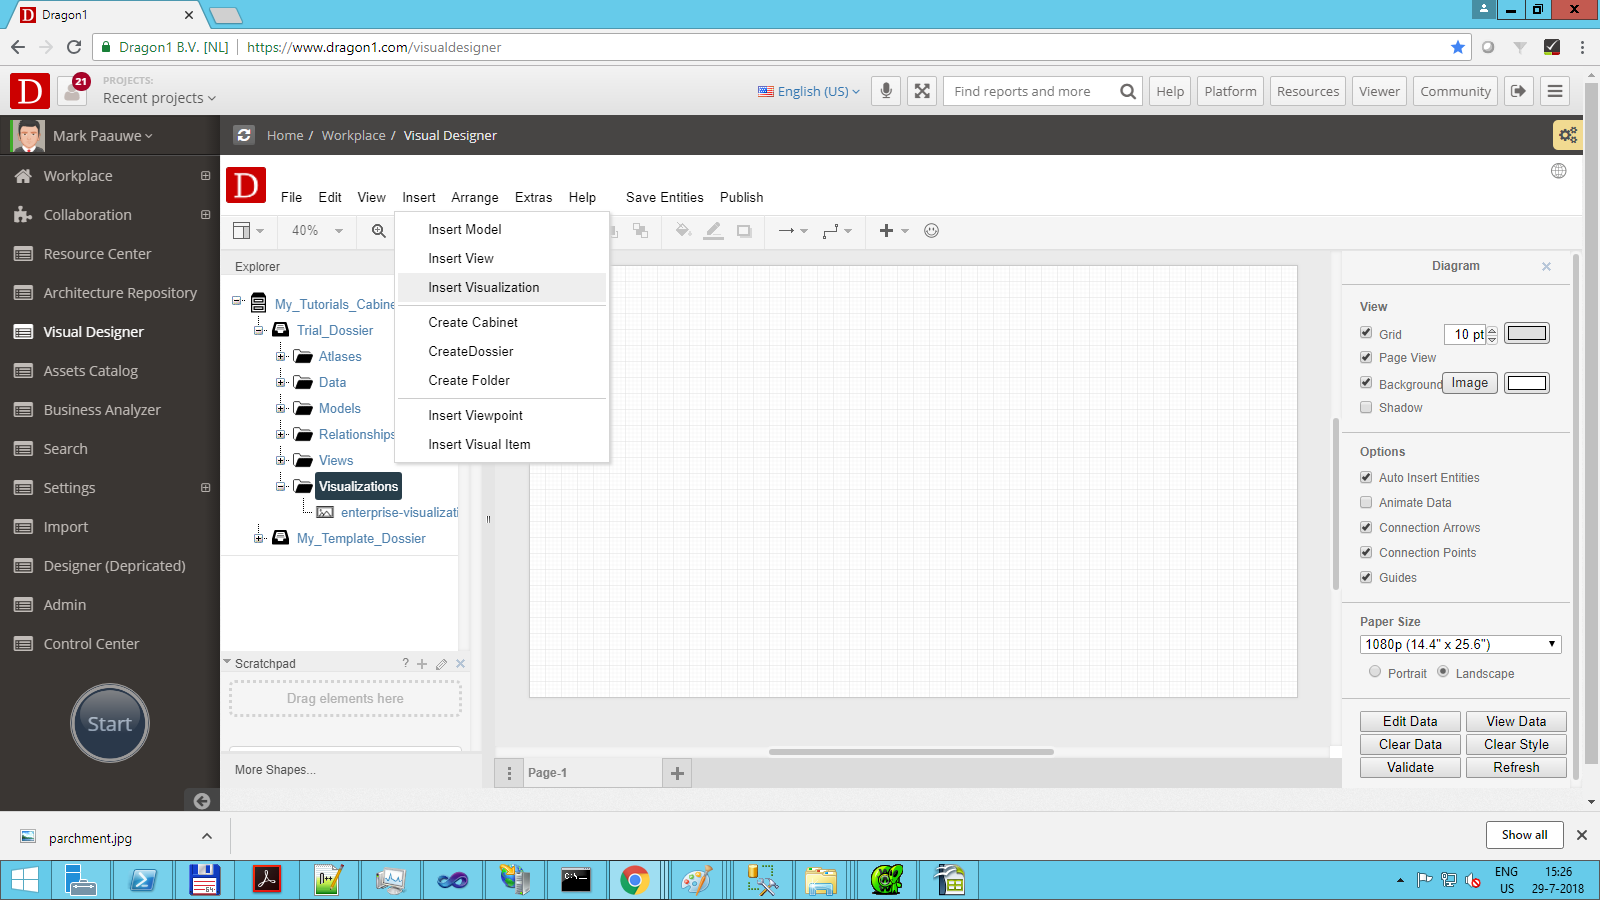
- Alternatively, create a cabinet here via the menu item Insert --> Insert Cabinet, and next insert a dossier in the cabinet and next insert a folder in the dossier likewise.
- In the cabinet, there are dossiers and folders. Expand a dossier (by clicking on the plus) and select a folder (by clicking on the name).
- Next, insert a visualization via the menu item Insert --> Insert Visualization.
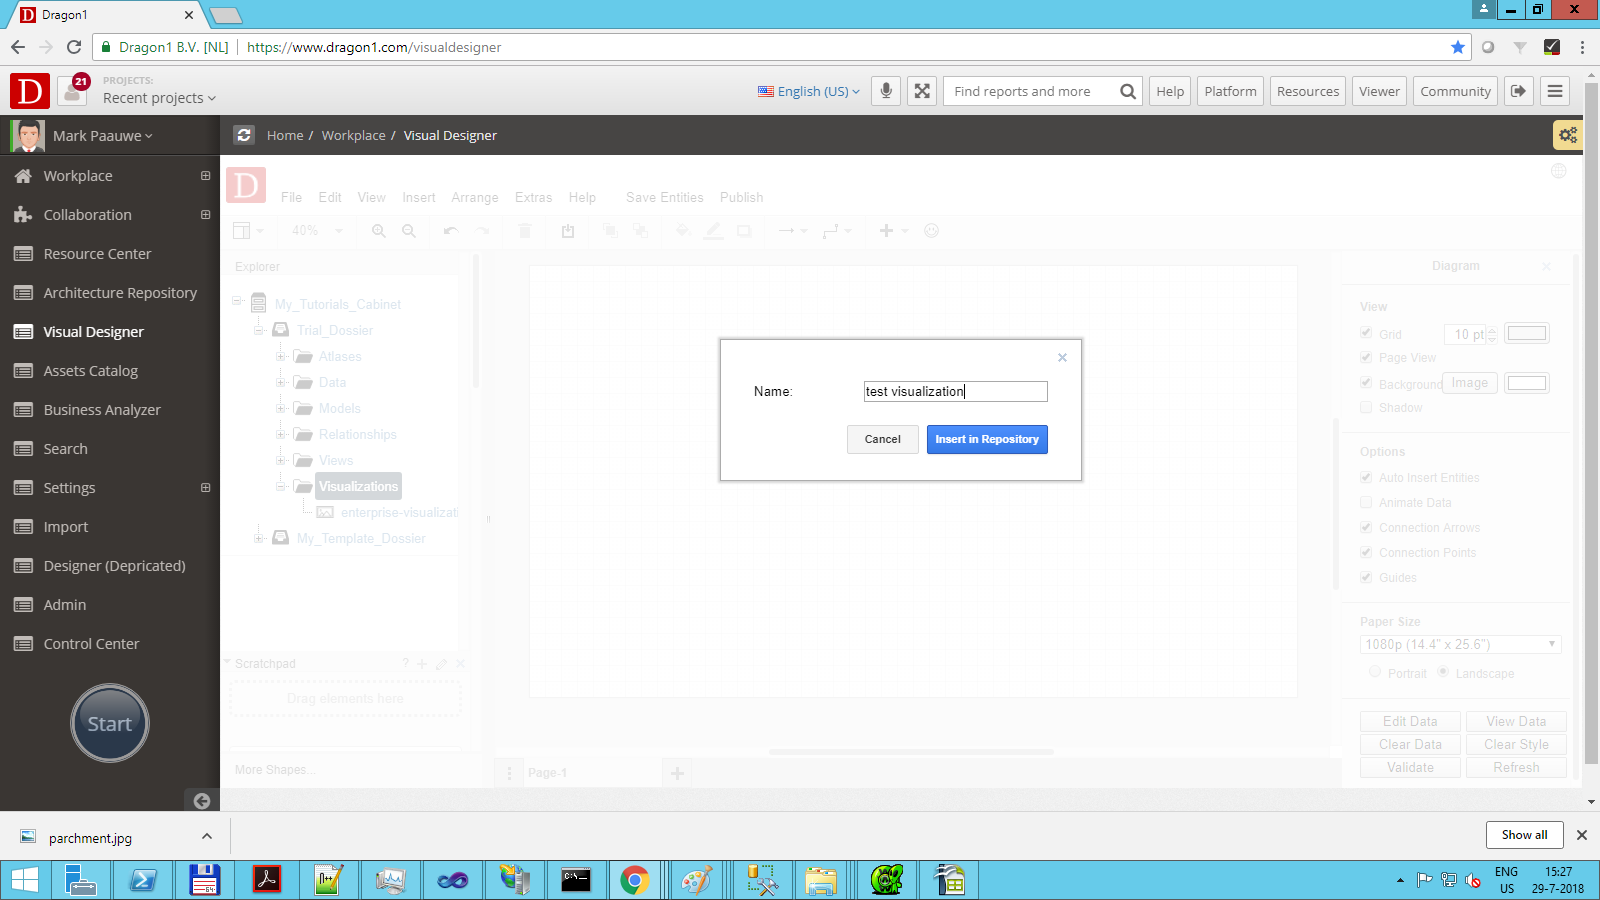
- Next, provide a name for the visualization in the dialog and click on the button 'Insert Visualization'.
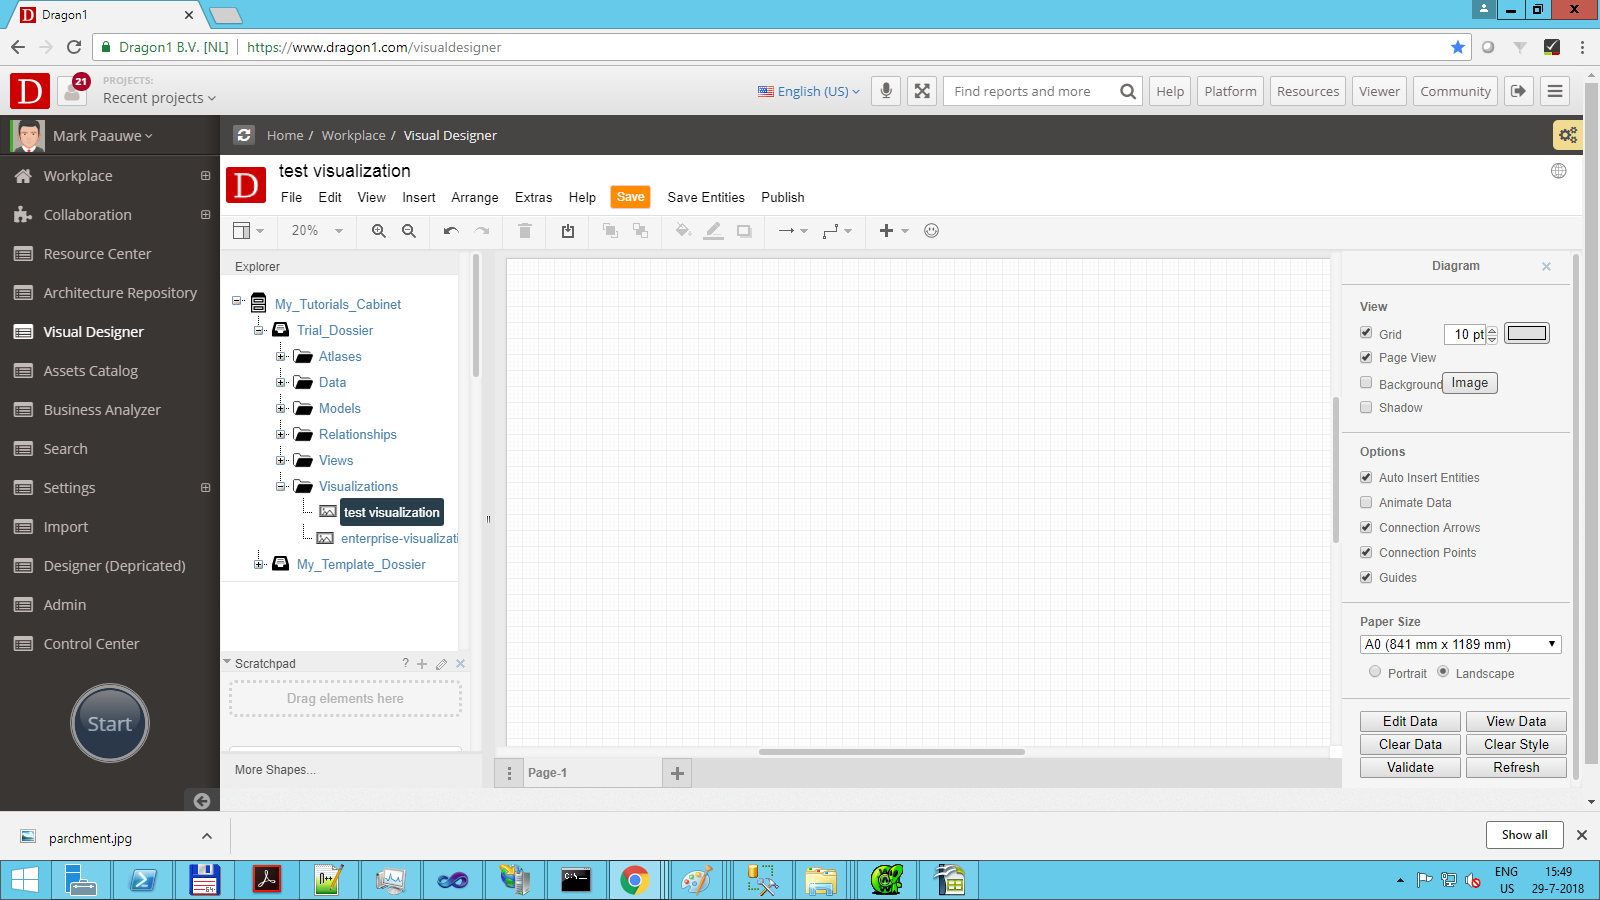
- Next, select that visualization item in the tree view.
- Next, choose a template via File --> New…
- Select a template in the dialog by clicking on the picture.
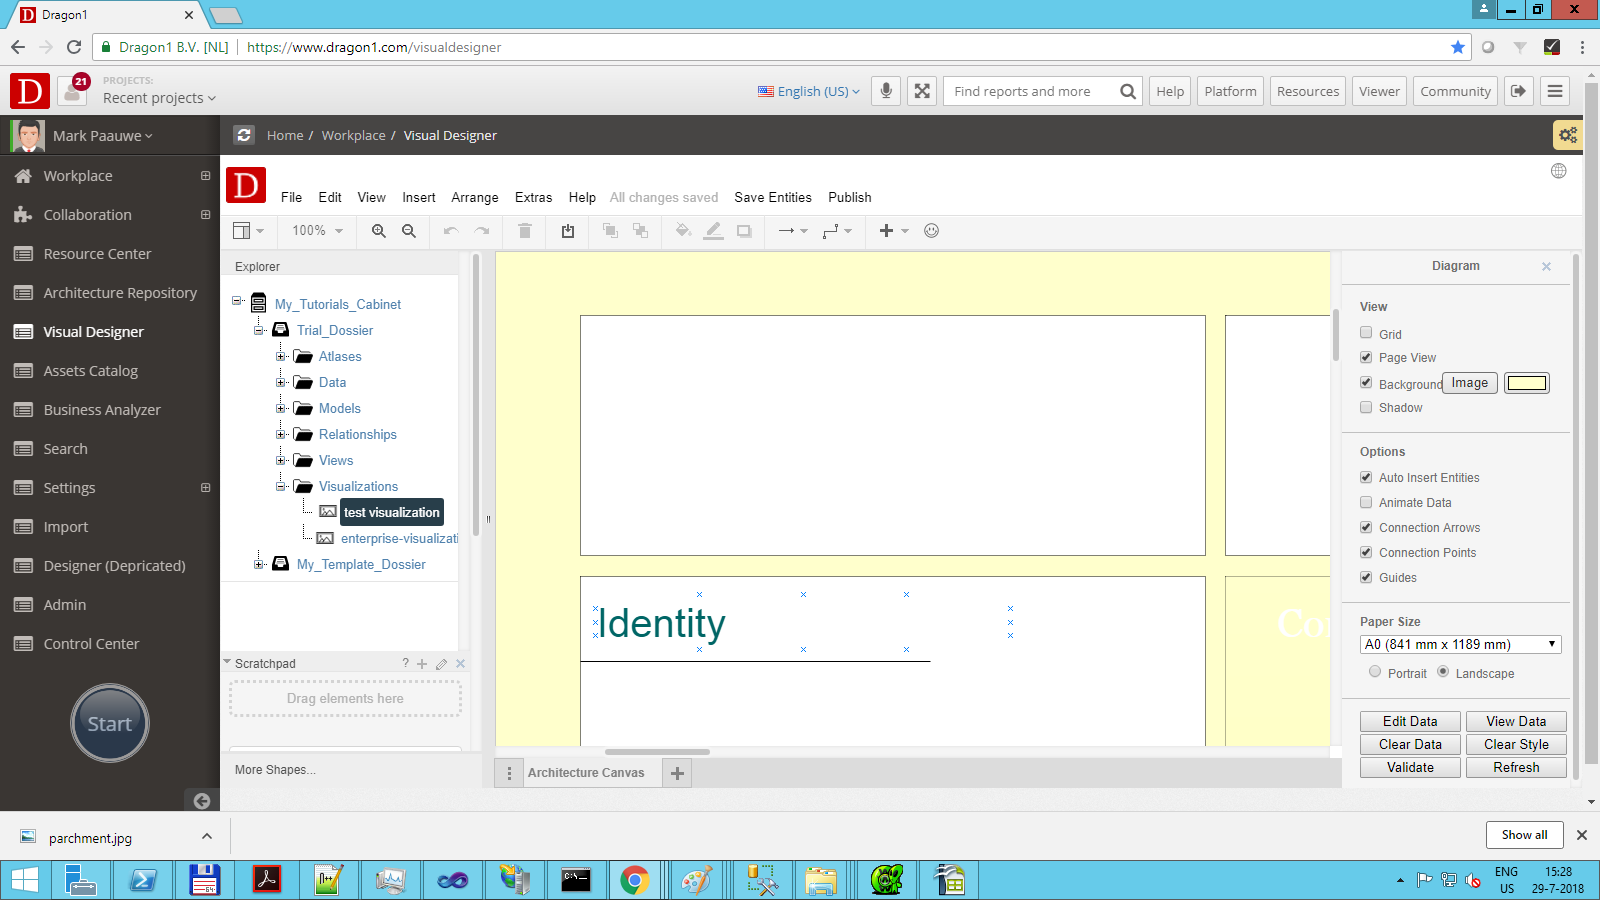
- Now, you see a visualization instantiated on the visualization canvas.
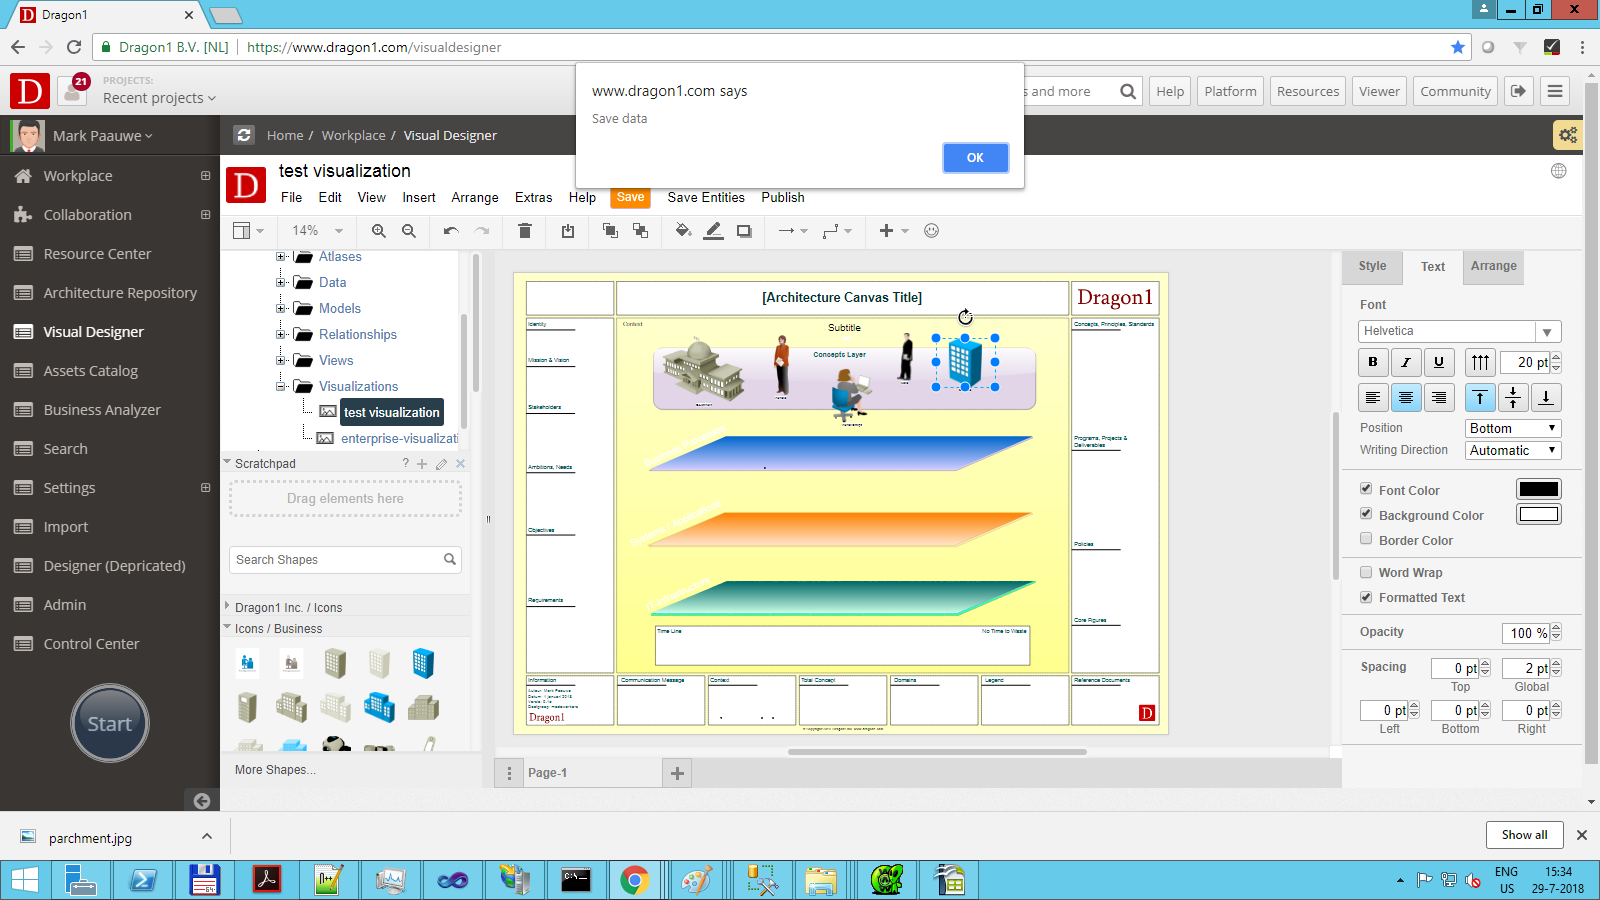
- Next, Click on save.
Create a Static Visualization using Shapes
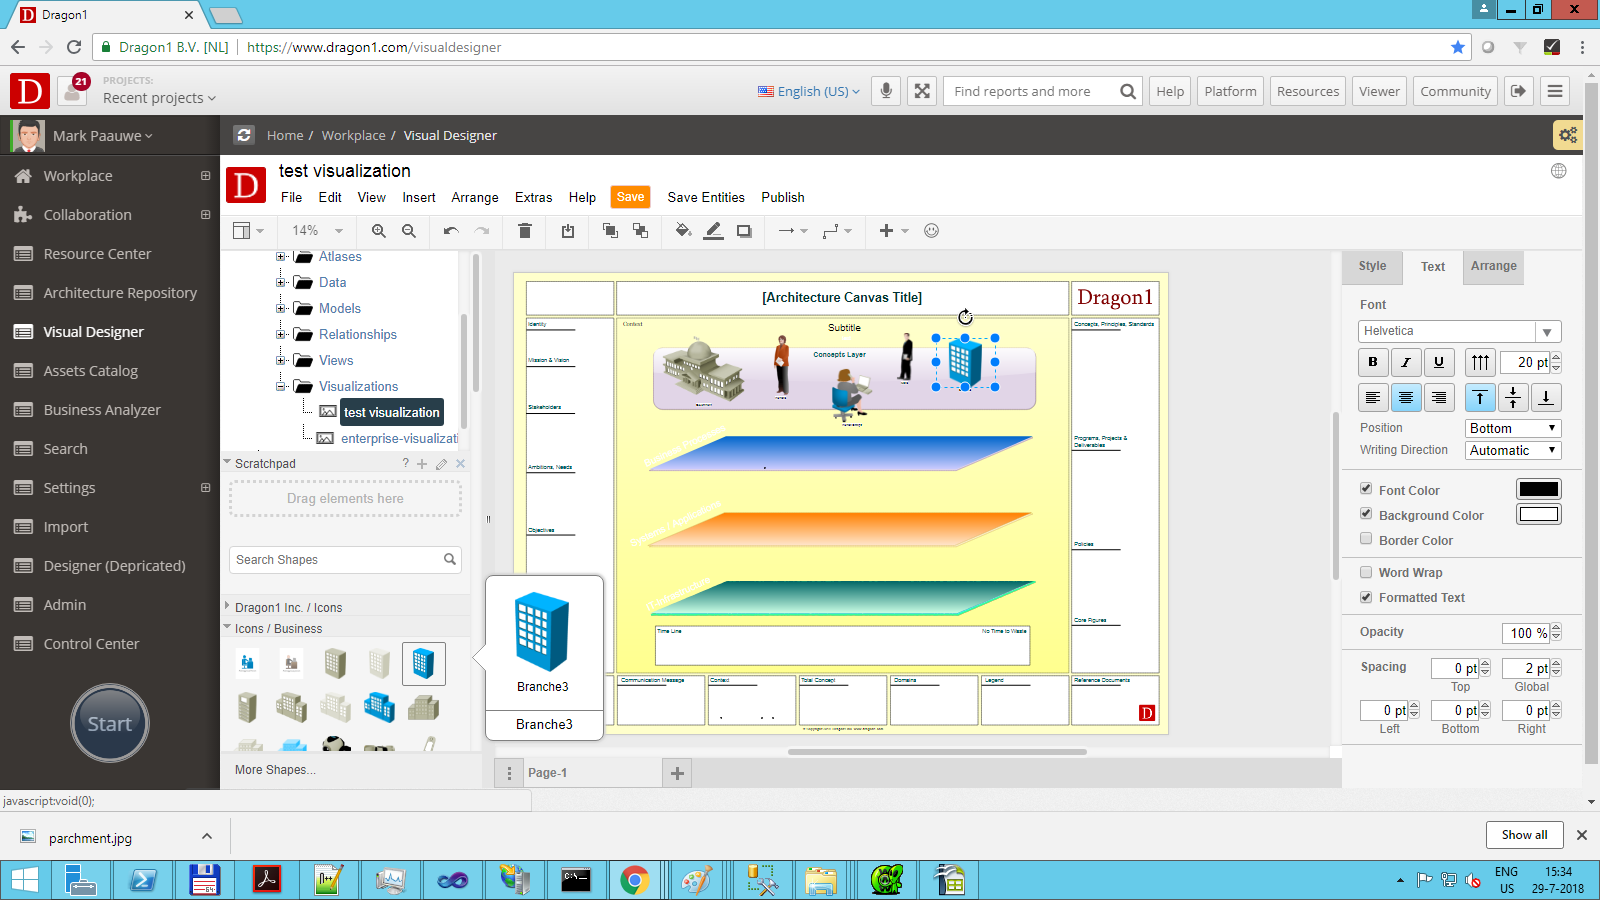
You can follow the steps above, but instead of using a template, you can also use many shapes grouped into a library to draw a visualization.
First, make sure you have selected a visualization item in the tree view. Next, go to the left bottom of the Visual Designer application and expand the icon libraries you see (just by clicking on their name).
You can also choose to open up other libraries by clicking More Shapes...
The first icon library you see has the name of your account and is often first empty. Here, you can add your user-defined icons.
Create a Static Visualization via the Templates page
All these steps above can be done in 1 click.
If you log in to Dragon1 and then go to the template page www.dragon1.com/workplace/templates, you only have to click on a template to have it instantiated, put into a cabinet, and shown to you in the visual designer.
Screenshots on How To Create A Static Visualization
Here, follow the screenshots of every step of how to create a static visualization.
Hotkeys or special clicks were done. It is mentioned in the screenshot.
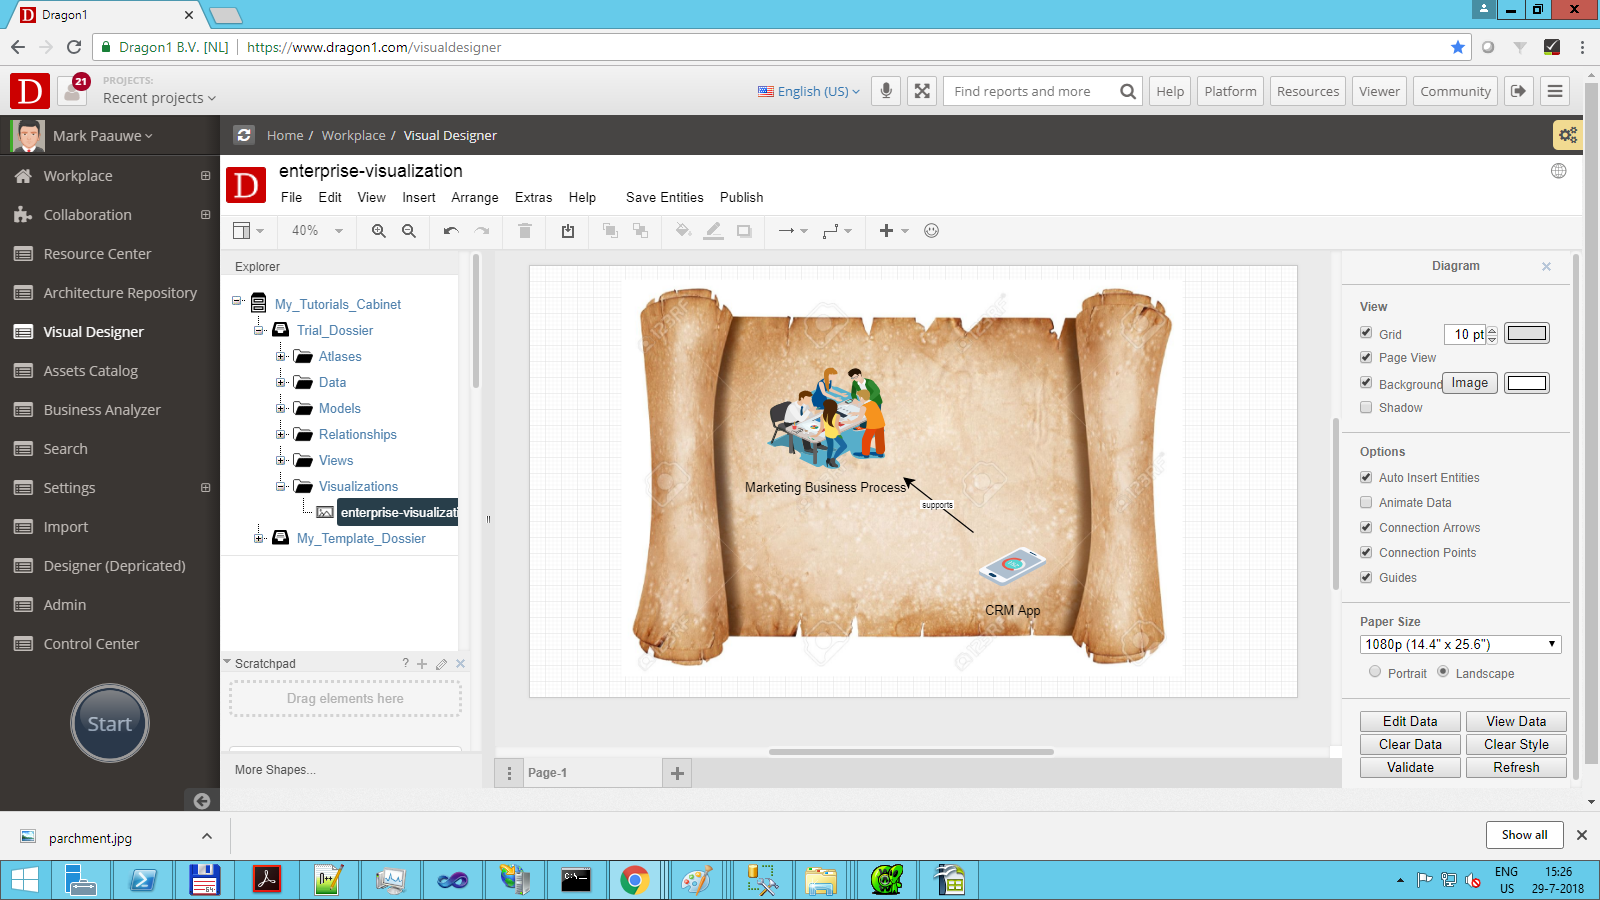
In the cabinet, there are dossiers and folders. Expand a dossier (by clicking on the plus) and select a folder (by clicking on the name).
We have selected a visualization item to check if the visualization canvas has content. If you choose a folder, you will always see an empty canvas).
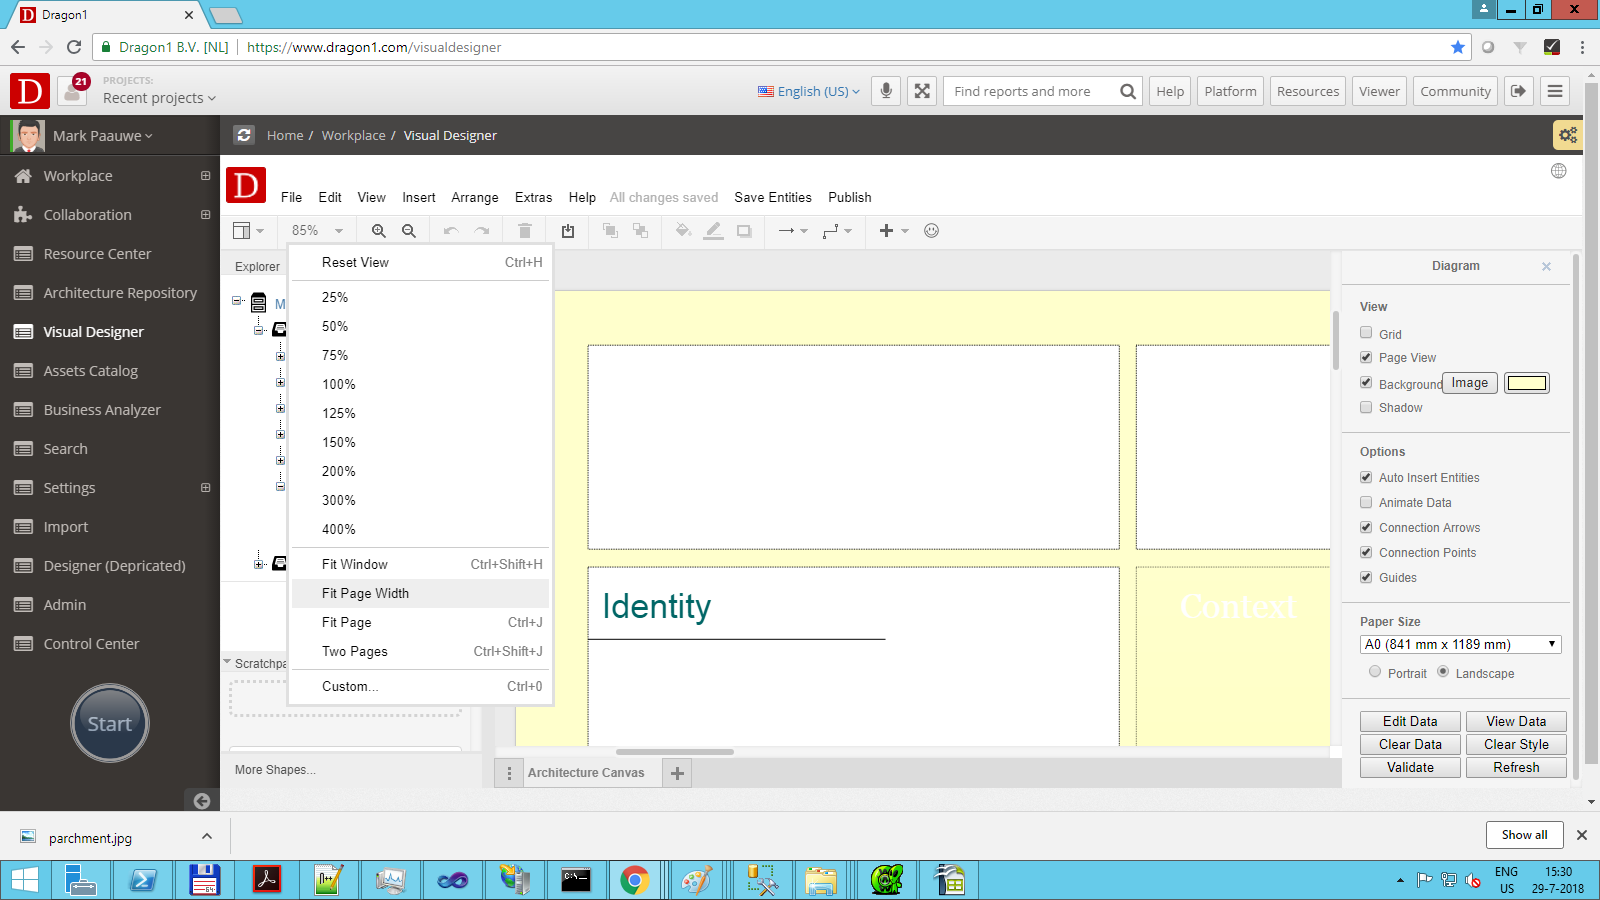
NOTE: If you want to enlarge the tree view, you can click on the word "Explorer" once and twice:

