Dynamic Views - Scenario 3: Dependency View
A dependency view shows different types of entity classes in columns or rows. The view also shows the relationships between the entities.
You can choose to see all entities, even if they have no relationship. Also, you can set the opacity (=transparency ) to 0 and make the entities that are not related invisible. You can make the entities that are not related a bit transparent.
Enter Data for Entity Classes
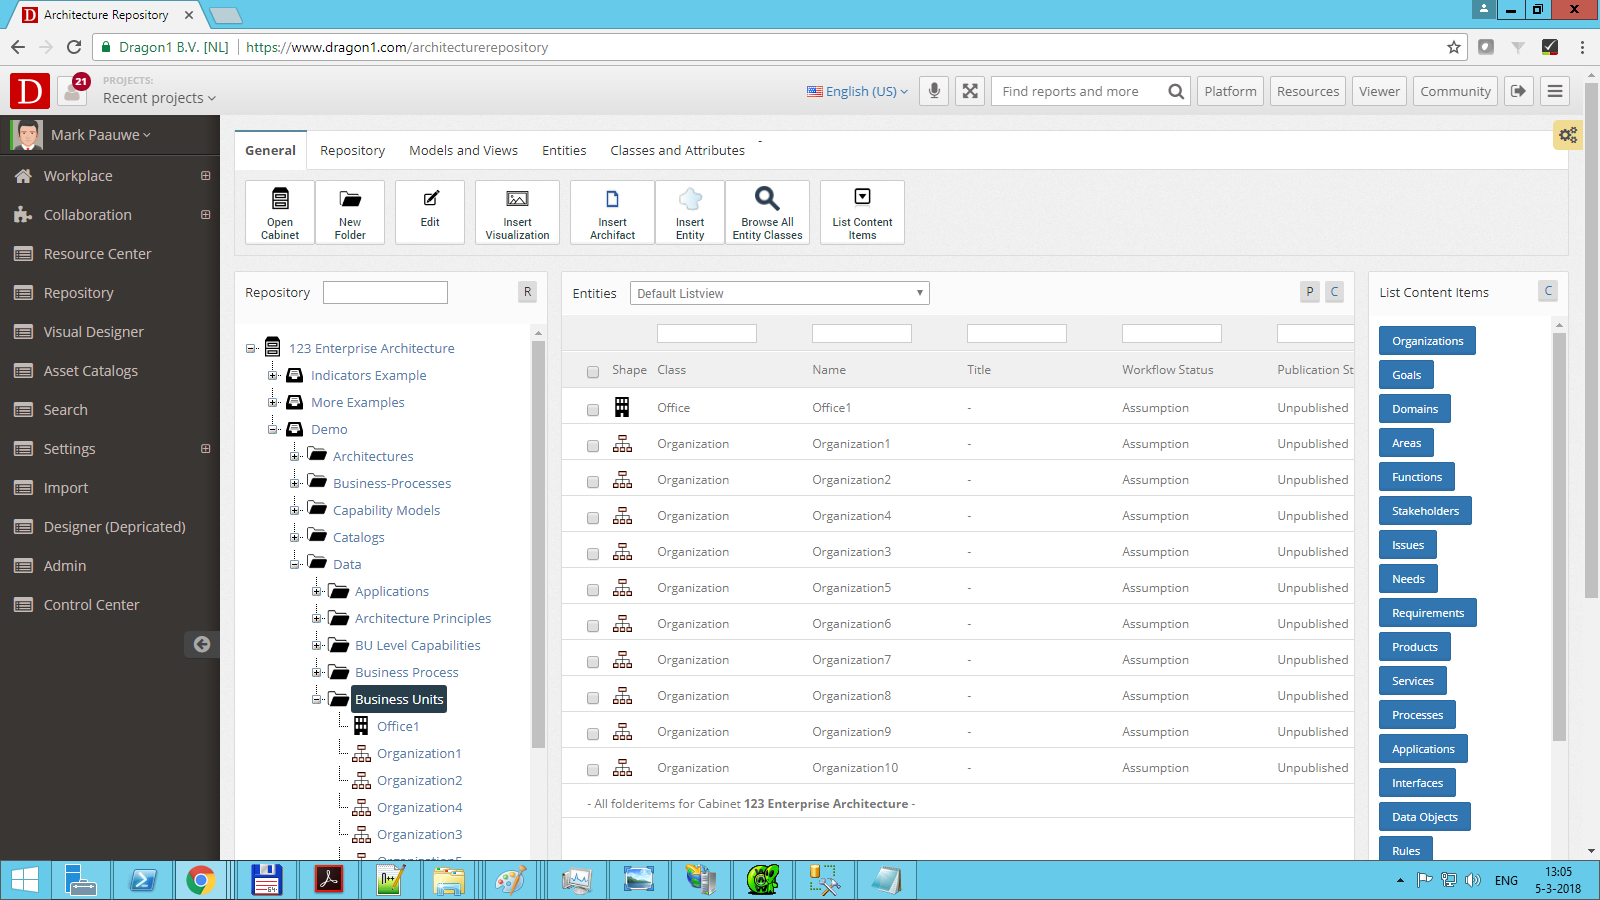
Create a Folder or Select a Folder:
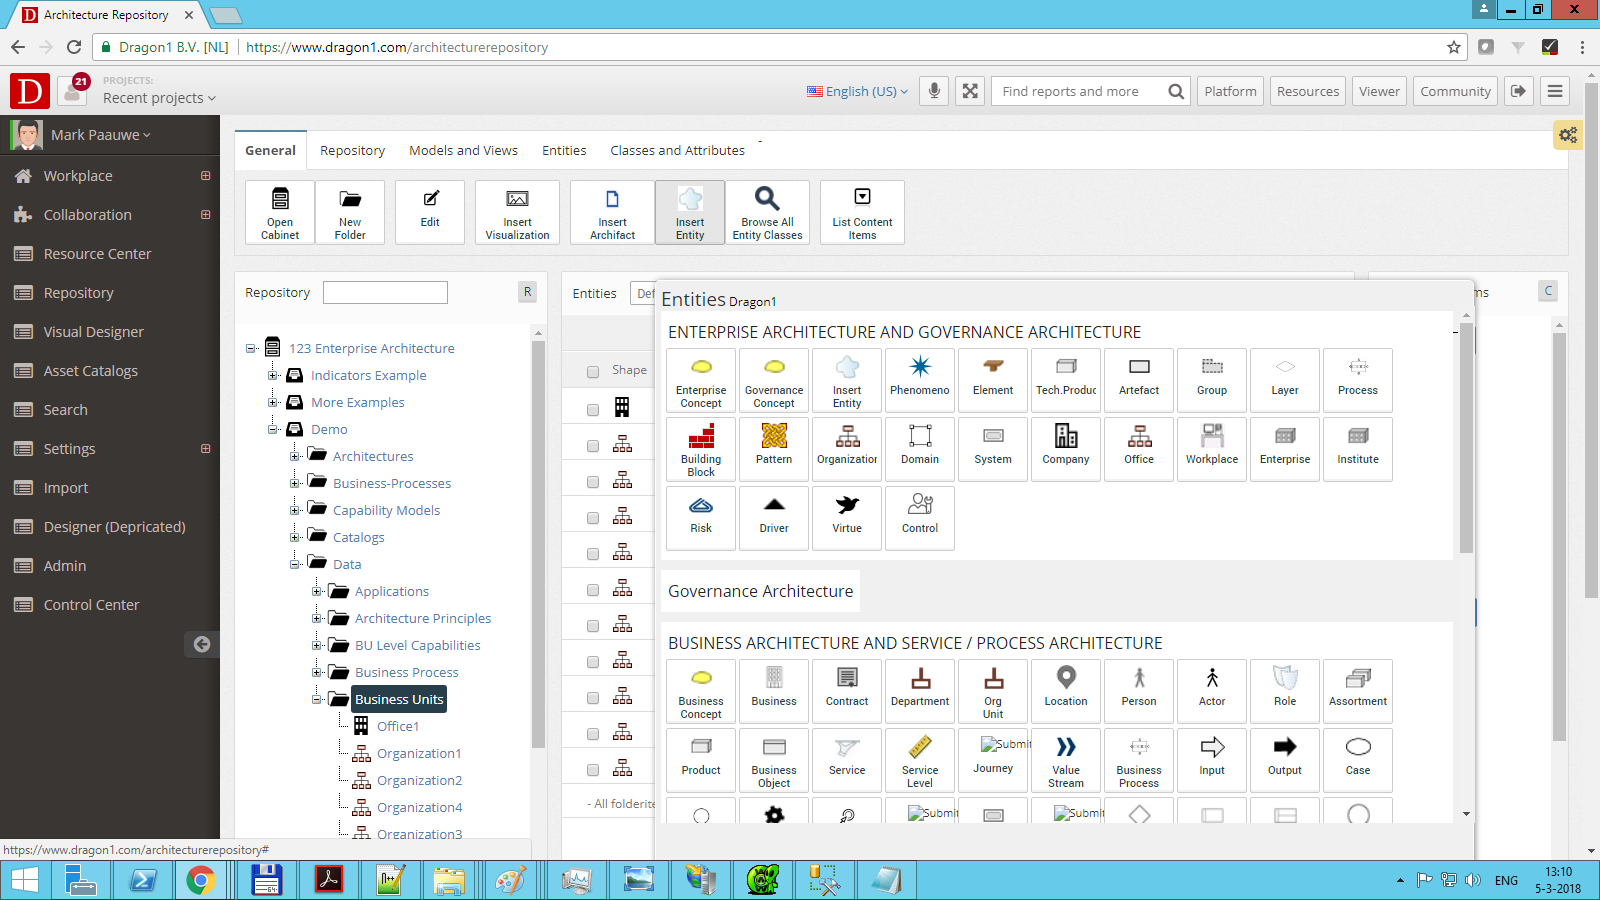
Click on Insert Entity:
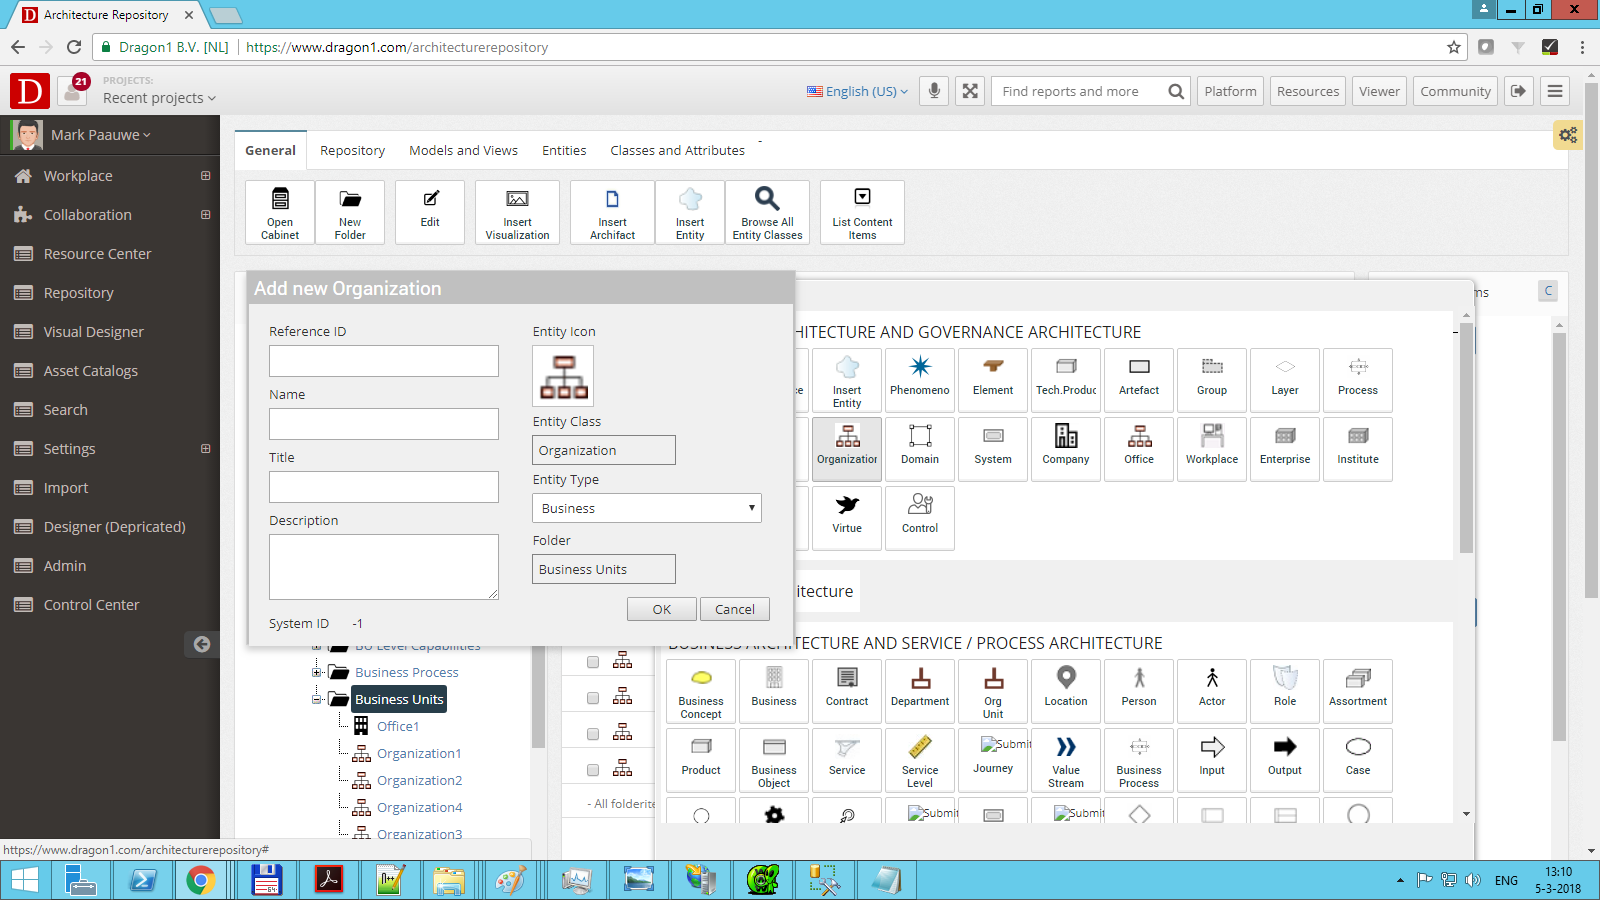
Select an Entity and Fill in the Data:
Create Relationship Between Entities
Select a folder and click Insert Relationship:
Fill in the Dialog by clicking the browse buttons and selecting items. When you are finished, you click on Make.
You see the relationship added in the folder.
Configure A View
Select a Visualization in a folder:
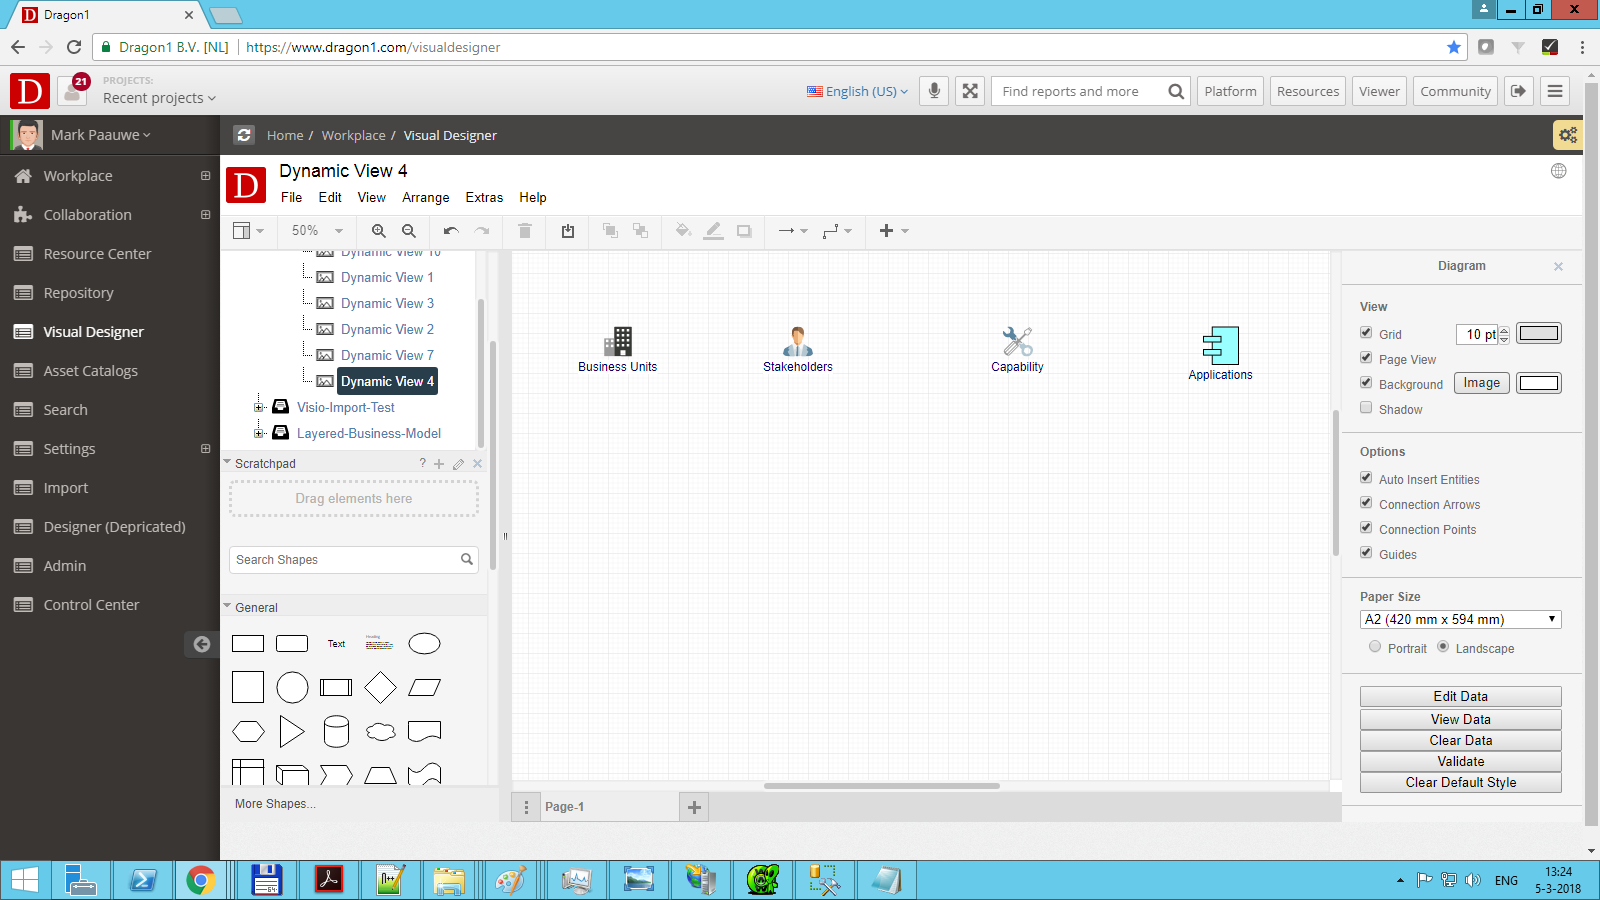
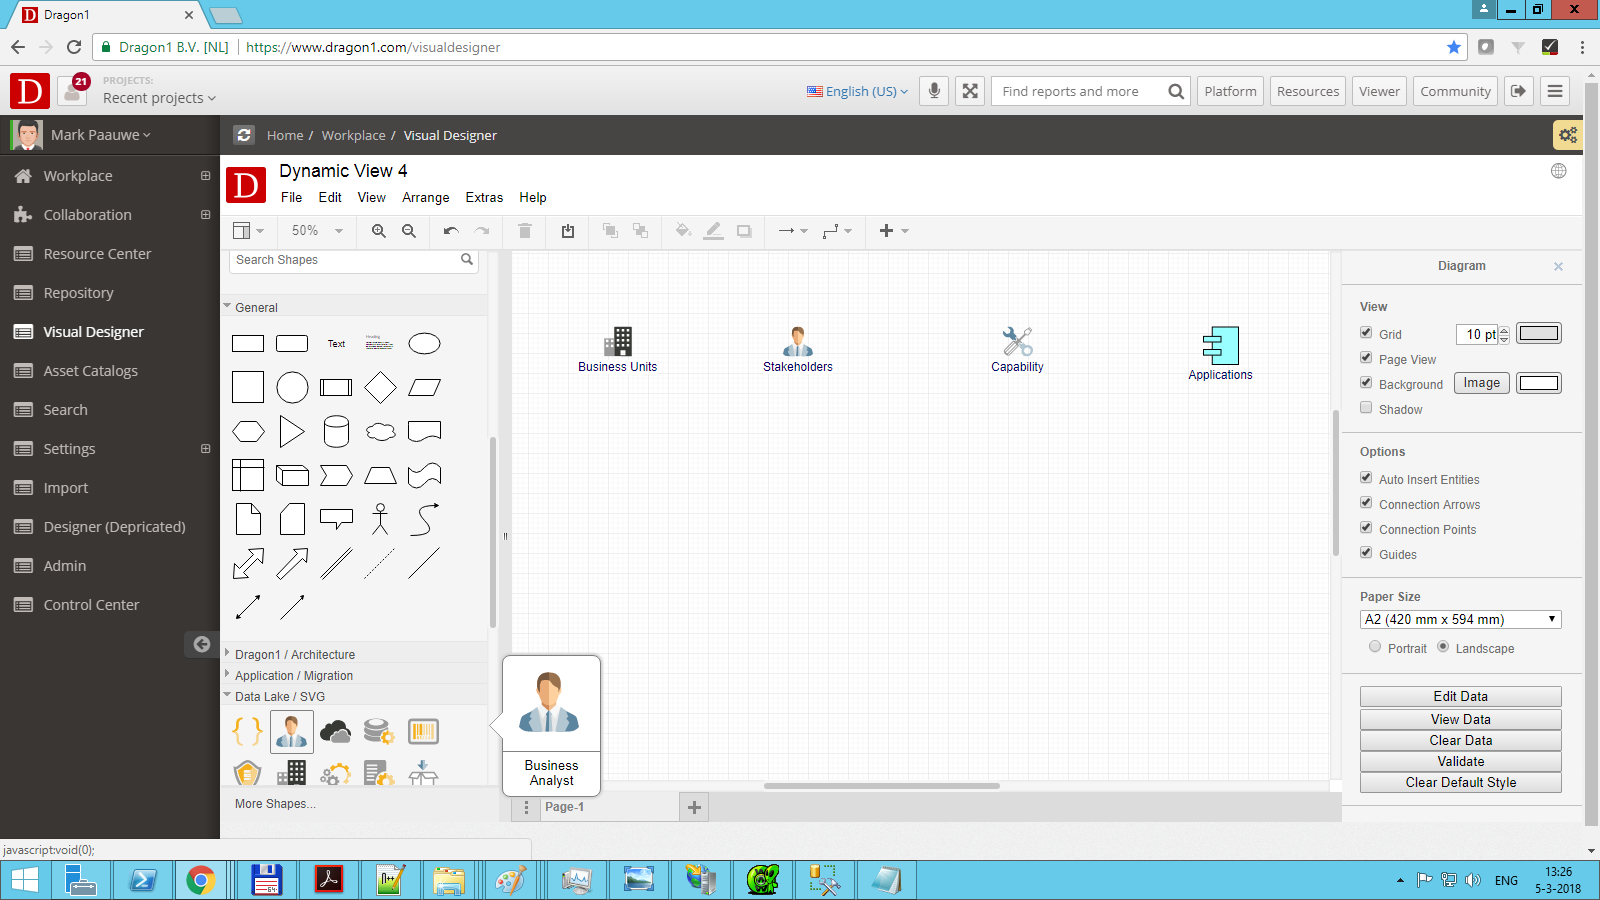
Click on a shape icon in a folder to insert it into the canvas.
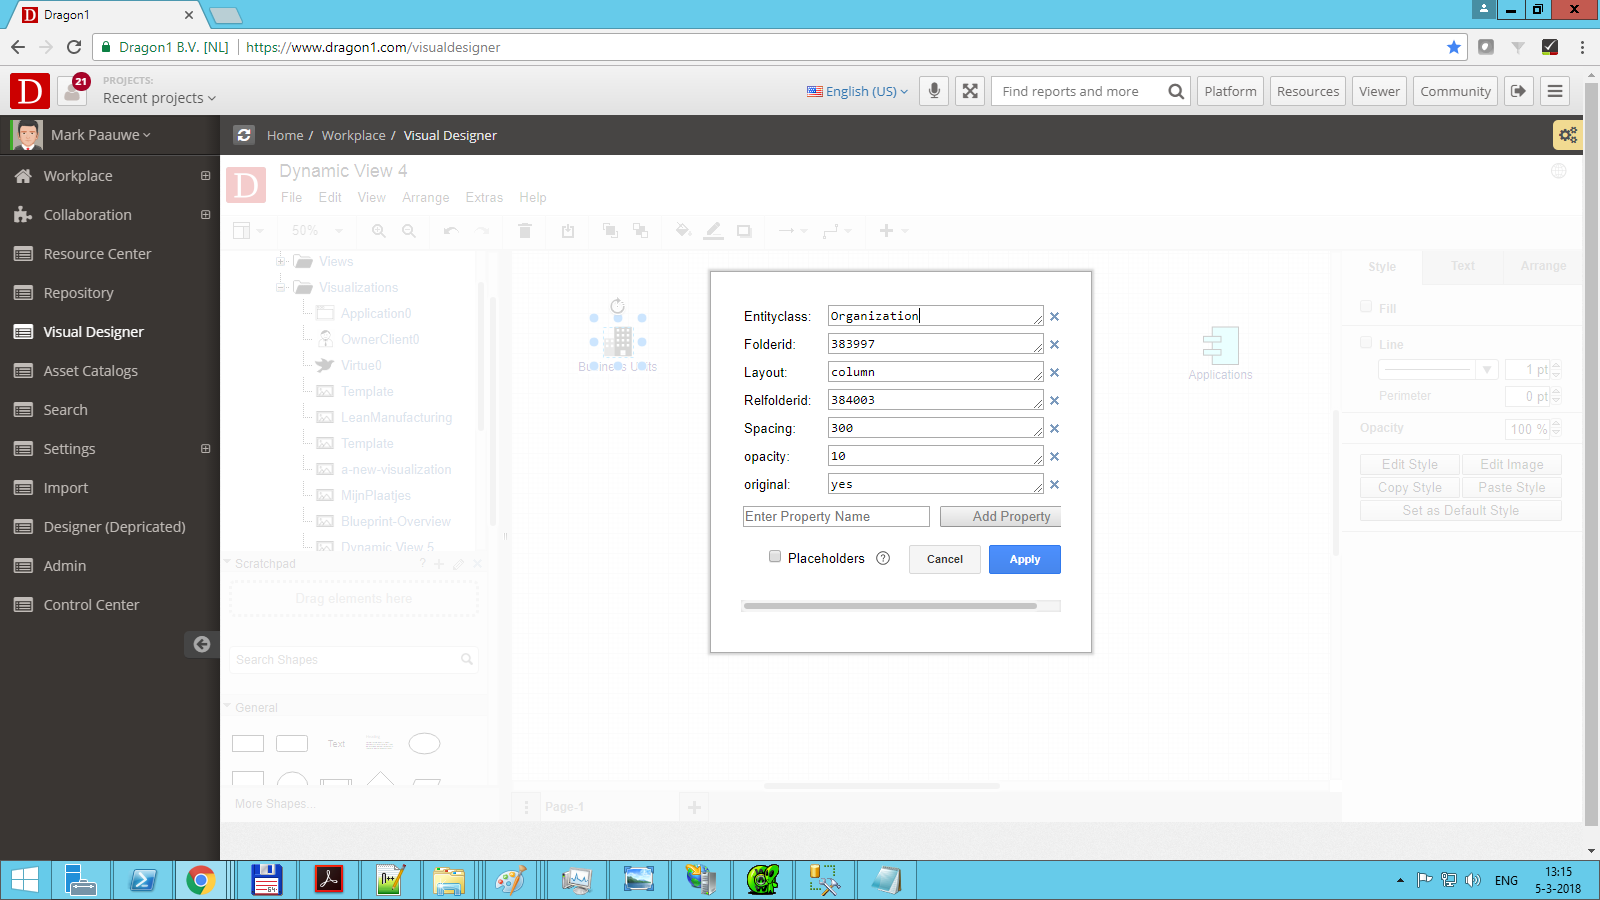
The icon will be inserted, including its name, ID, class, and folderid.
You can also select a different shape from the bottom left, as shown in the screenshot. But then you must fill in all the attributes yourself at the shape.
You only need to add, at least, the Relfolderid where the relationships are located. If you want non-connected entities hidden, add Opacity with a value of 0. In the example, it has a value of 10, which means that unrelated items will be very transparent.
Generate the View
To generate the view, select the background or the canvas and then click on the button 'Generate View'.
If you save your visualization, only the non-generated items will always be saved, so your original visualization is always saved.
To revert to the original visualization, click the 'Clear View' button.
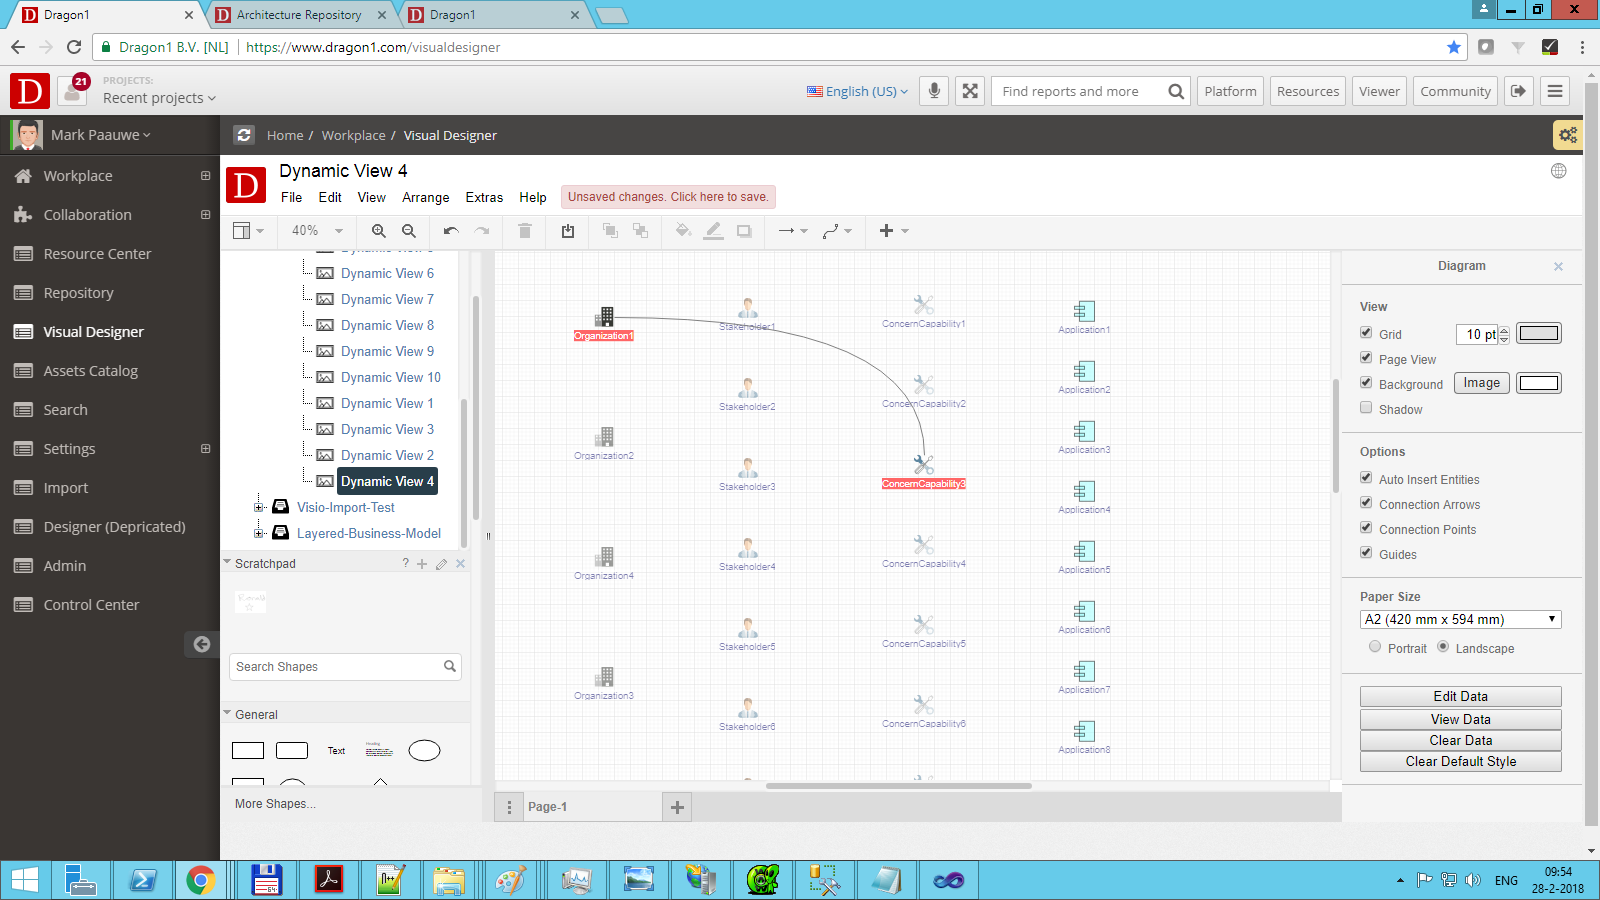
Below, you see an example where the opacity of icons changes depending on which relationships there are:
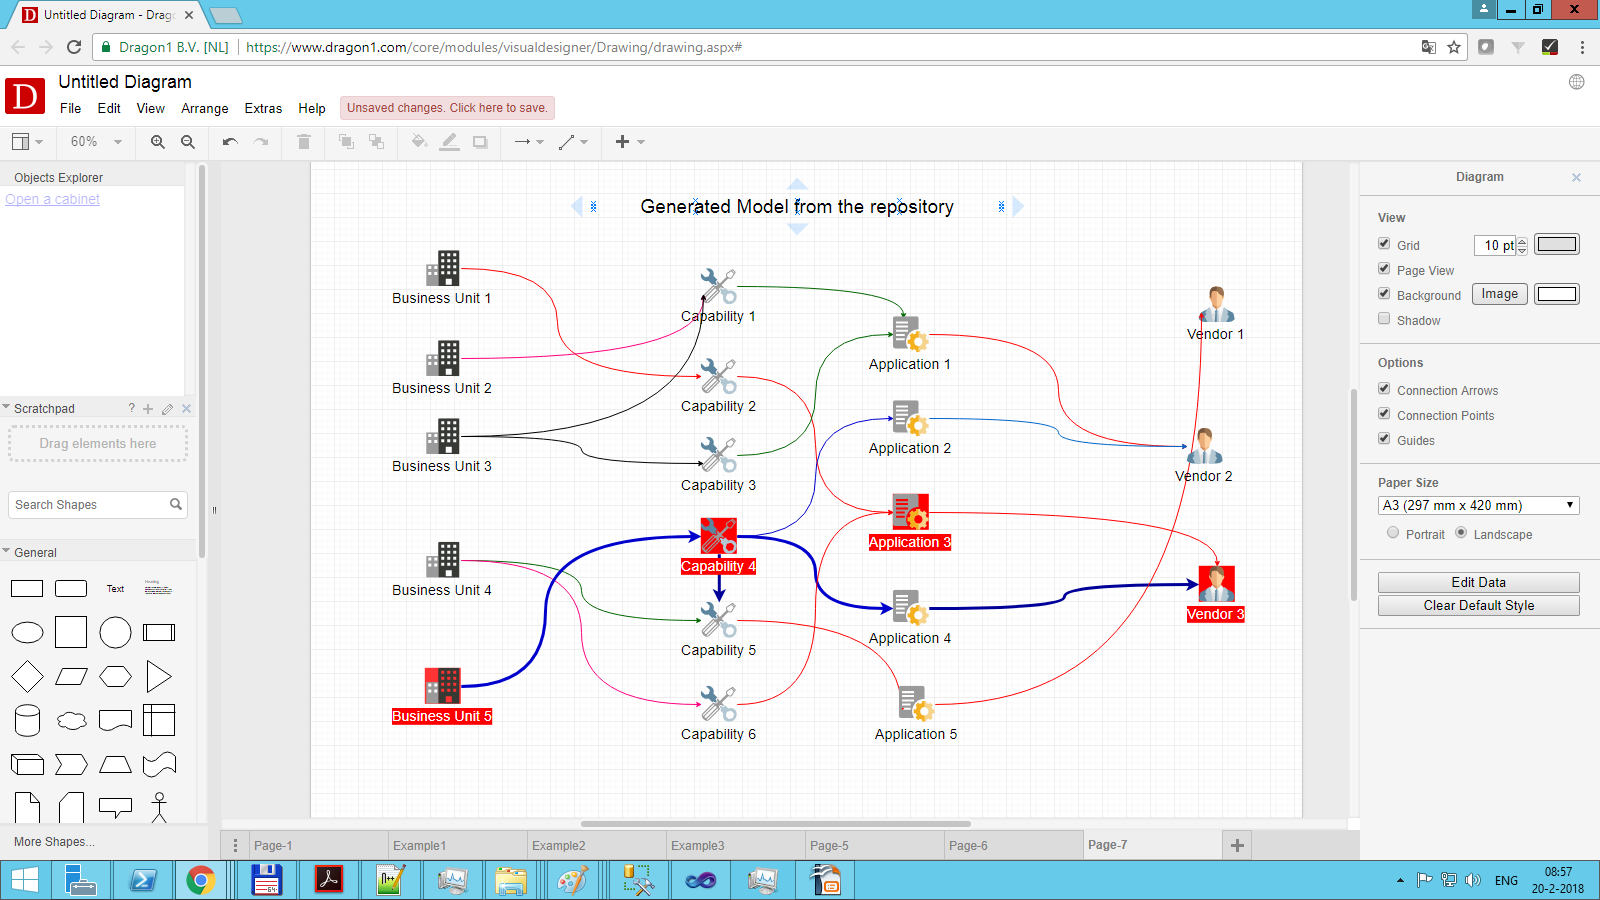
Below you see an example where no opacity is used:
Changing Layout
You can have the shapes presented in different layouts.
Go to menu Arrange-->Layout and choose an option, for instance, Circle.


