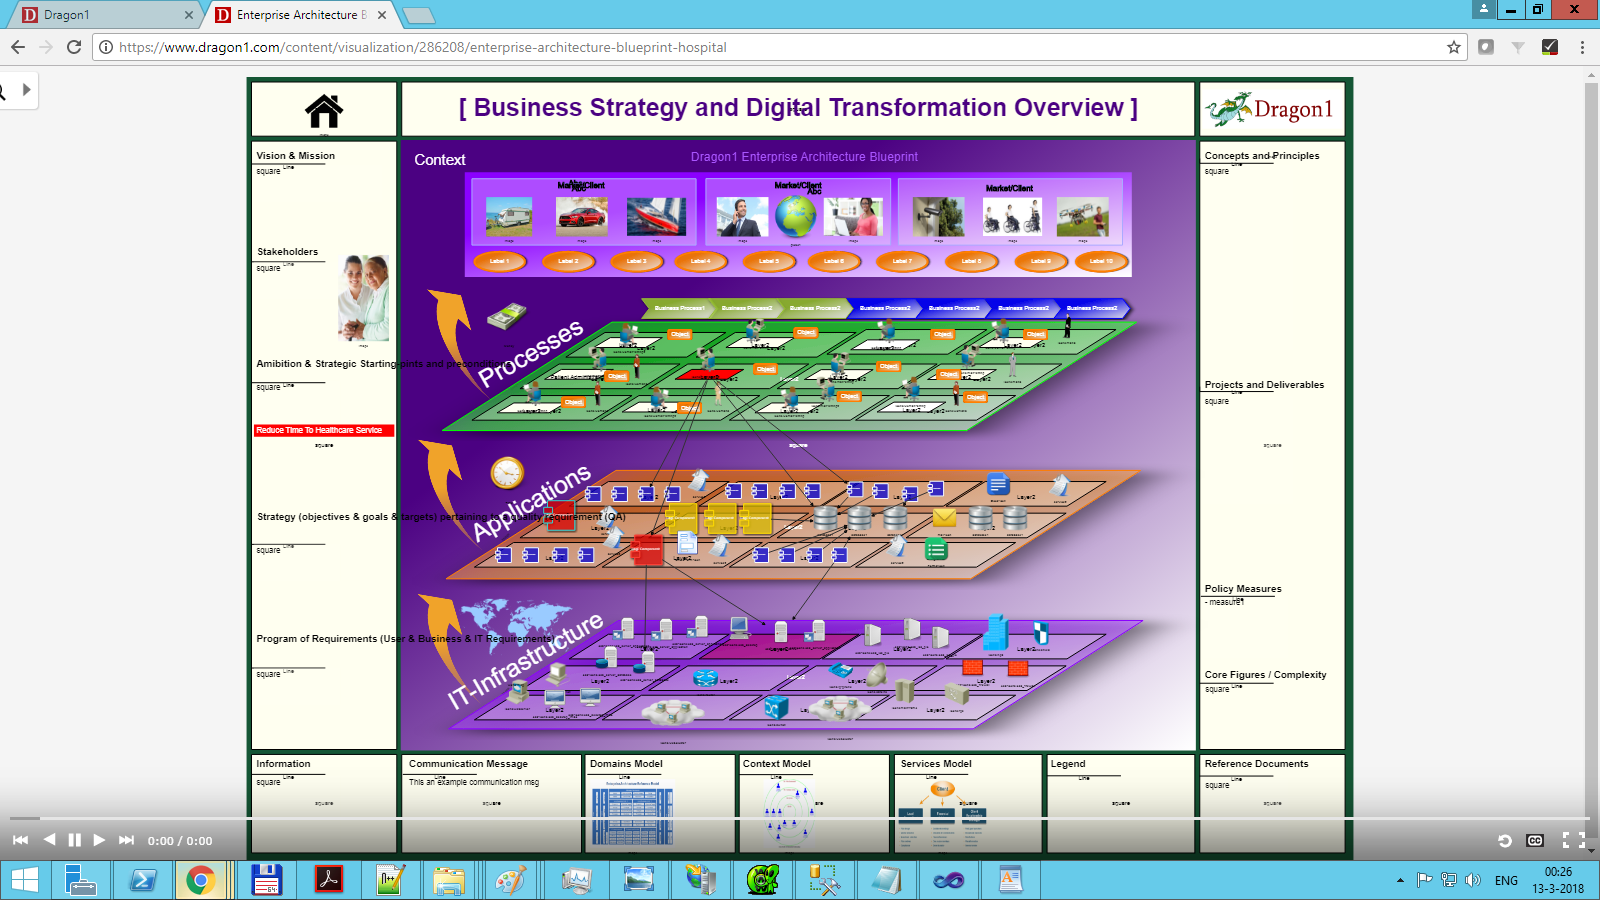
Dynamic Views - Scenario 11: 3D Enterprise Architecture Blueprint
To create a dynamic and interactive enterprise architecture blueprint on Dragon1 you need to take the following steps:
- 1. Collect data from different sources in the organization
- 2. Validate and relate the data collected
- 3. Enter or upload the data as entities
- 4. Create links between the entities
- 5. Create models with the links
- 6. Create views of models
- 7. Reuse the visualizations template
- 8. Create popup dialogs
- 9. Create click links to detailed visualizations
- 10. Publish the visualization in the Viewer
- 11. Use the visualization to project data and compare it with other models
1. Collect data from different sources in the organization
On an Enterprise Architecture blueprint, we have four groups of data: Strategy data, Structure data, Architecture data, and Transformation data.
The strategy data covers identity, mission, vision, stakeholders, objectives, goals, aims, ambitions, strategic starting points, business and IT requirements, and issues or concerns.
The structure data is organized into three, four, or five layers. A market & layer, a business layer, an information (systems) layer, an application and data layer, and an IT Infrastructure layer.
The architecture data covers domains, concepts, principles, capabilities, patterns, building blocks, and standards.
The transformation data covers programs, projects, deliverables, core figures, and policies.
In this Excel sheet, you have an example template you can use to collect the data for an enterprise architecture blueprint: dragon1-example-enterprise-architecture-blueprint.xlsx
2. Validate and relate the data collected
Once you have collected data from different sources, you need to increase the quality of the data by checking the source, ownership, workflow status, and publication status.
You must also define relationships between the data: how do the processes relate to applications and goals? How do project deliverables relate to processes and applications? How do identity, mission, and vision relate to each other? Once you have established the relationships, you have a data set you can use to create a blueprint.
3. Enter or upload the data as entities
You can enter or import the data via files.
First, you create a cabinet, a dossier, and a set of folders in the Architecture Repository.
- Data
- Strategy
- Structure
- Architecture
- Project
- Models
- Relationships
- Viewpoints
- Views
- Visual Items
- Visualizations
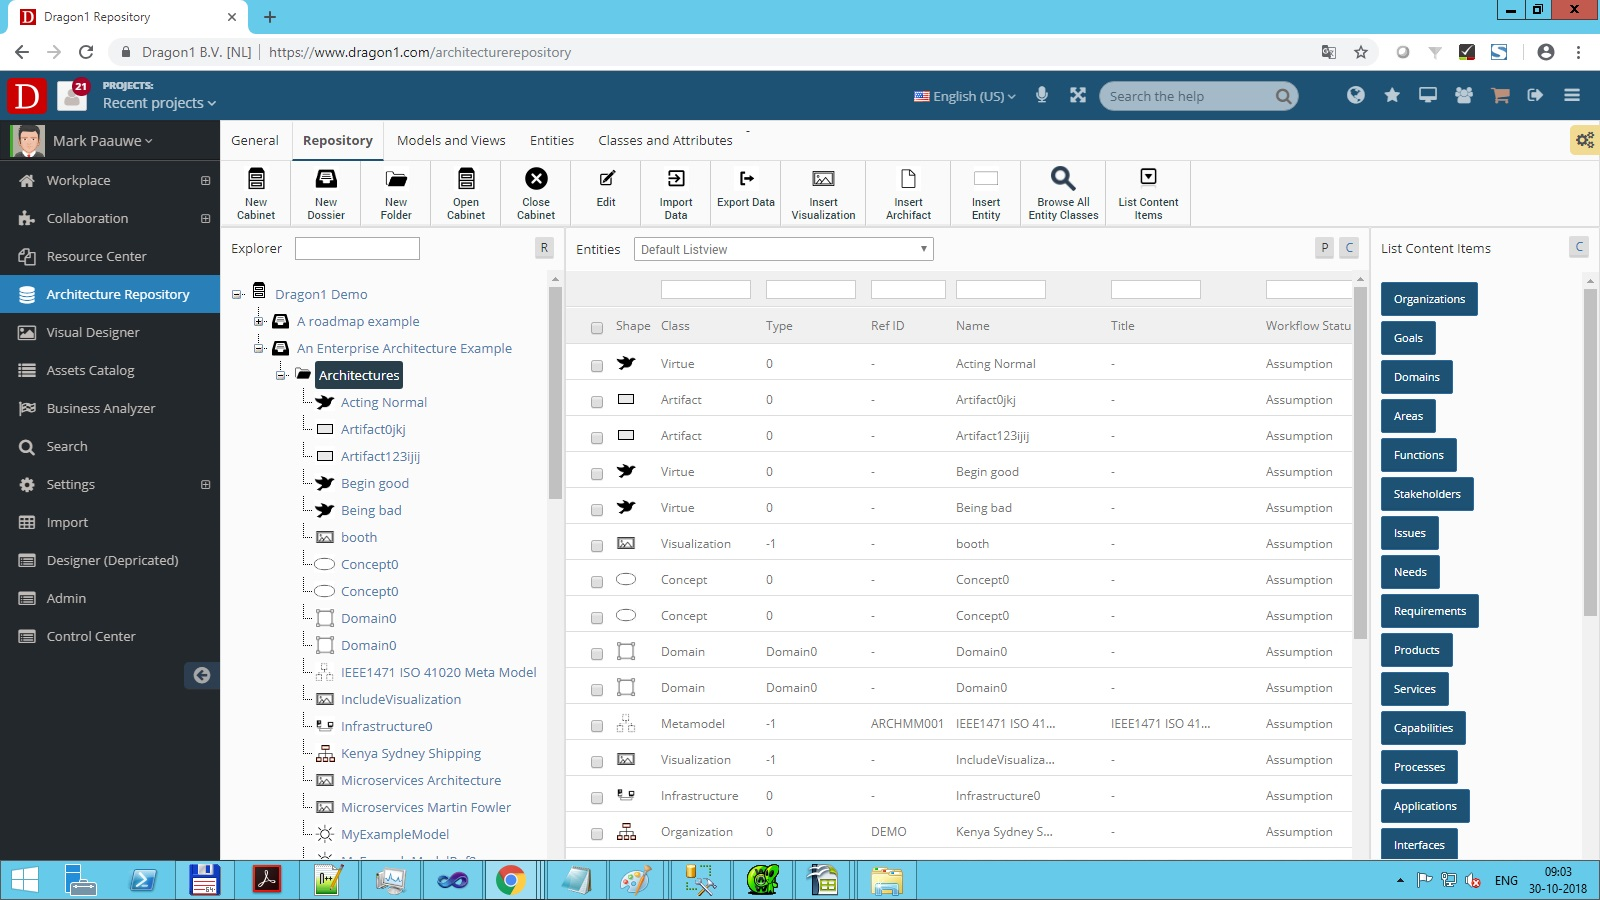
Next, you insert data entities via the menu bar in the repository. The screenshot below shows an example of entered data in the repository.
Here you can read about how to import files
4. Create links between the entities
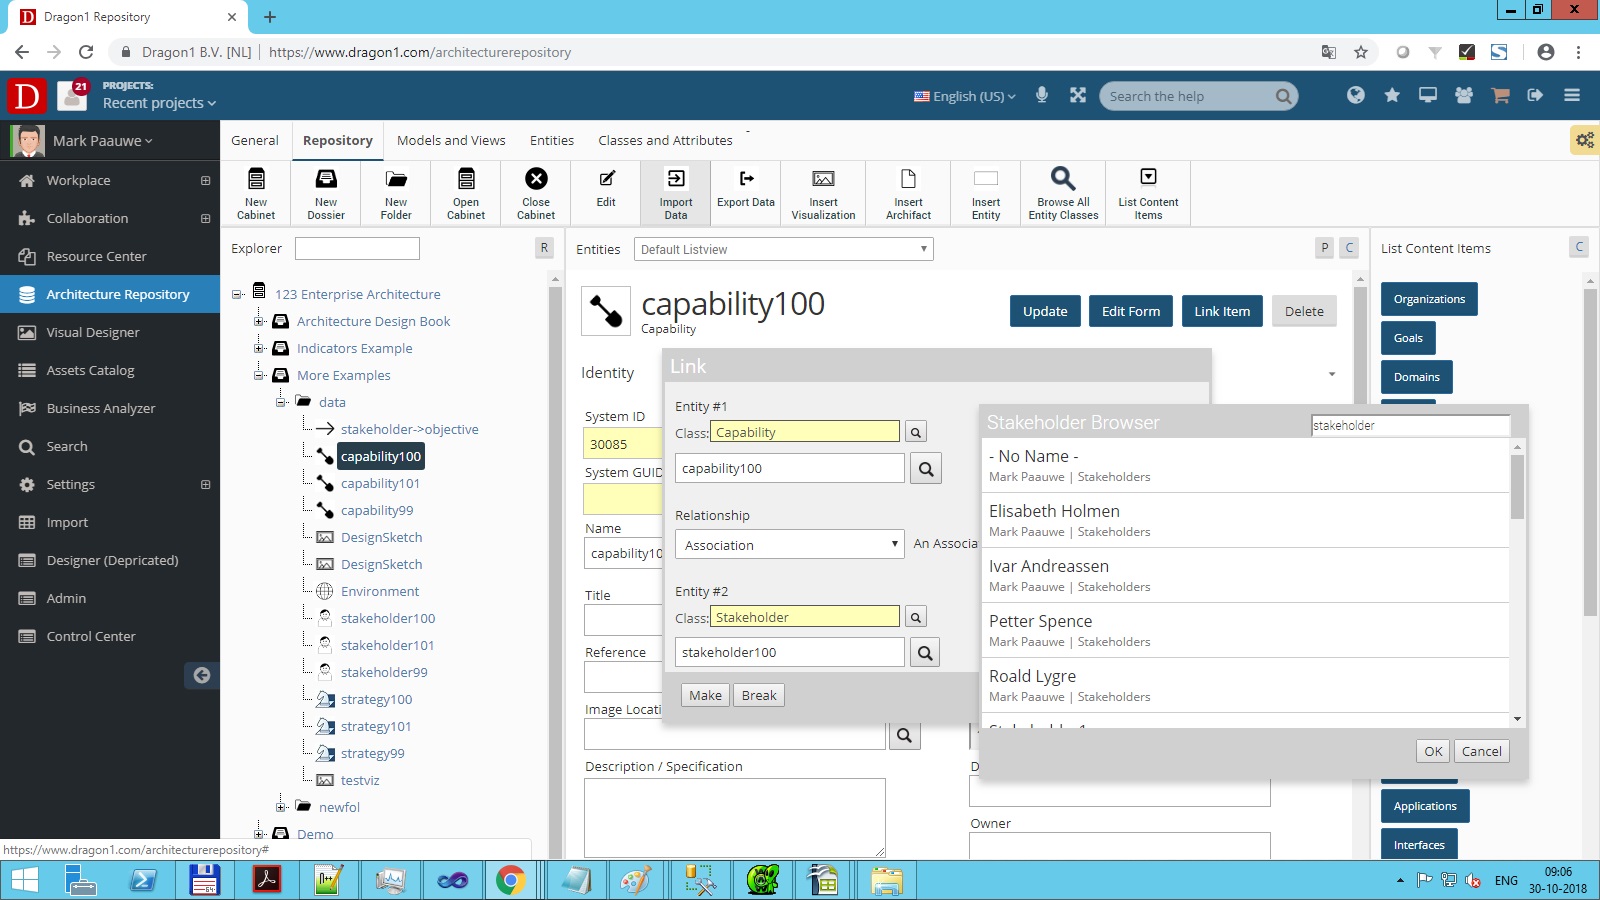
You need to create relationships between the data entities. We need these relationships to create dependencies and click links.
Use the menu button to create relationships.
5. Create models with the links
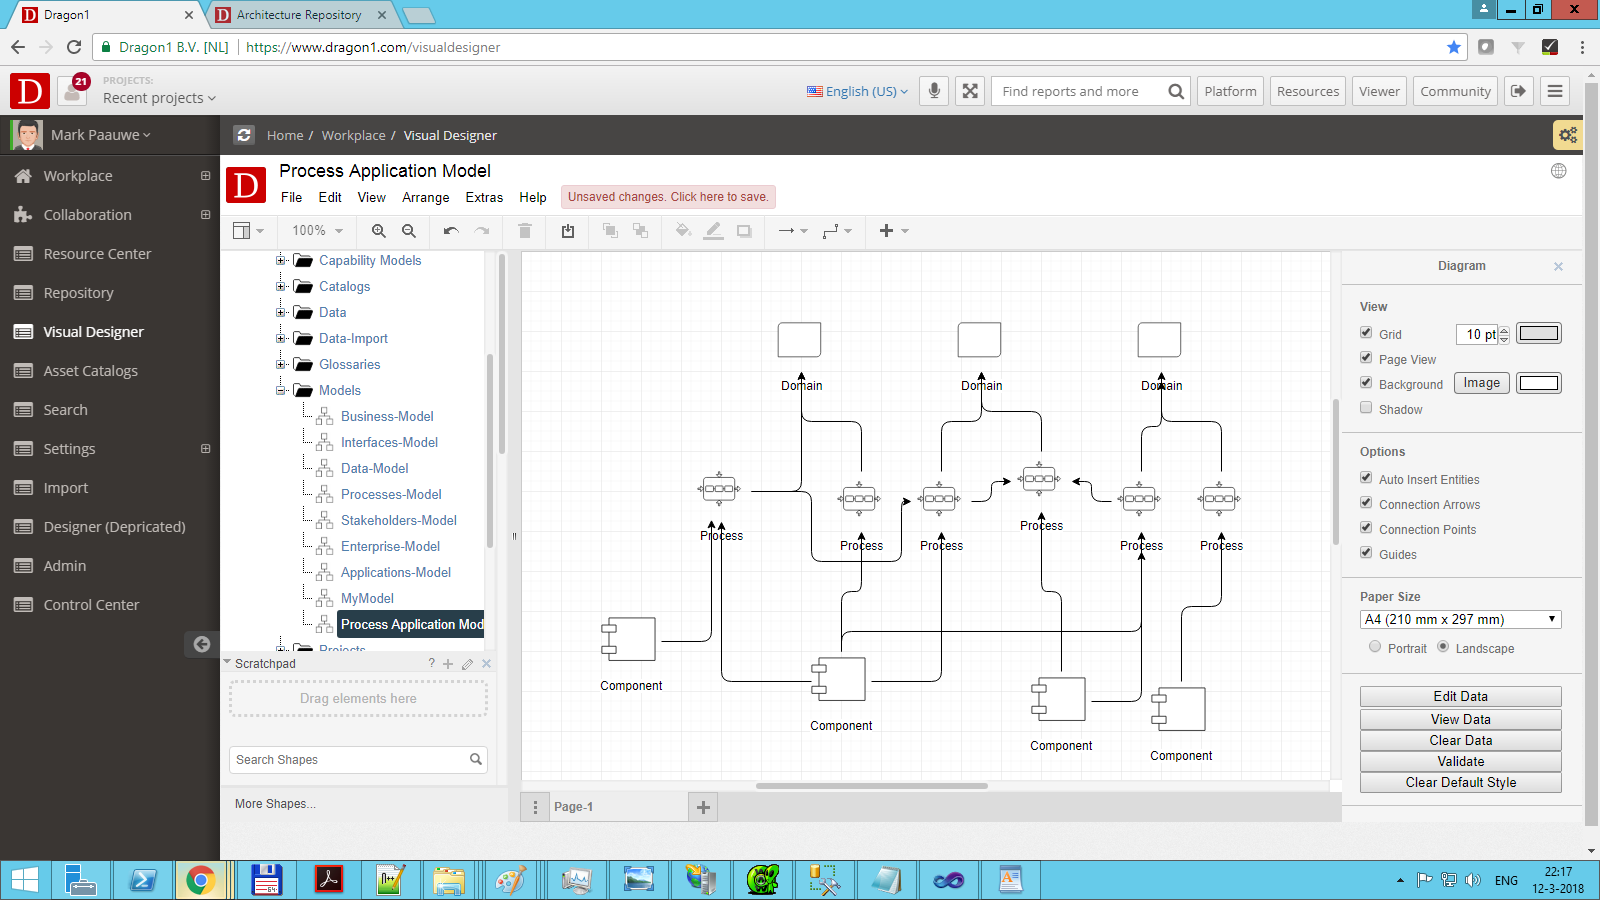
A model is a set of relationships between entities. In Dragon1, we reuse as much as possible, so we only need to reuse the relationships to create a model.
To create a process model containing all the processes, create a model in a folder, drag all the processes and relationships to the canvas, and save the model.
6. Create views of models
We work with stakeholders, viewpoints, and views in enterprise architecture. With this, we can provide focused visualizations to support people in their decision-making roles, including those of director, manager, analyst, designer, and developer.
For instance, a financial controller or purchaser might be interested to know which application has more user licenses than bought and for which applications there are no service level agreements (SLAs) with the suppliers.
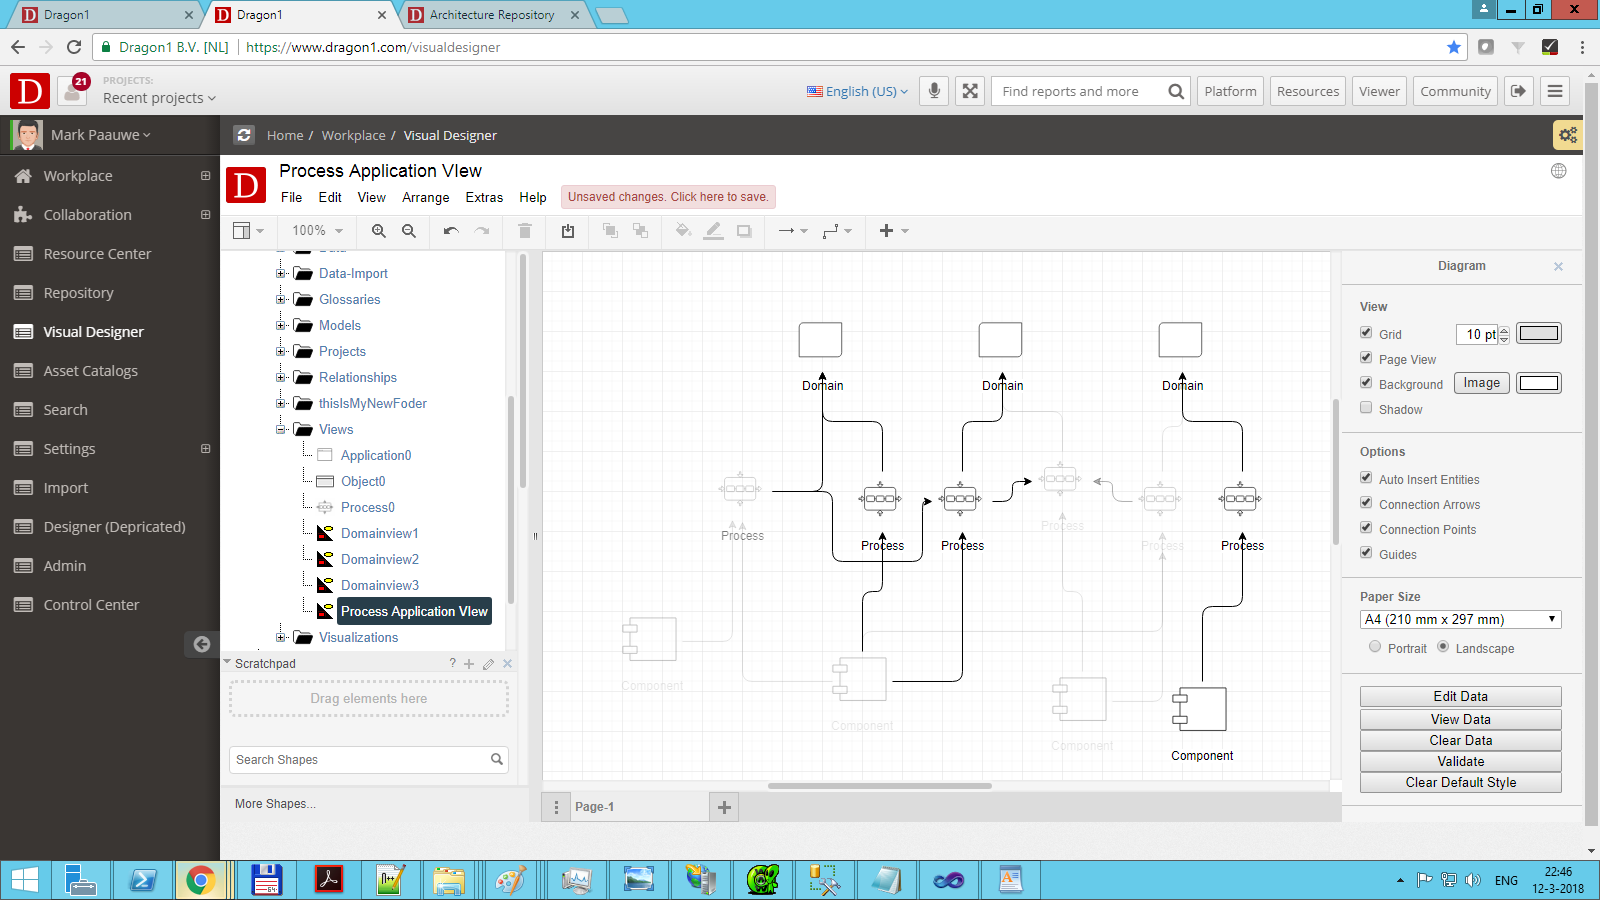
The purchaser, in this case, as a stakeholder, has an SLA viewpoint. The SLA viewpoint is a set of rules that filter out data from a model. Application onto the model, the resulting SLA application view only shows applications for which we have no SLAs.
Below you see an example view: the filtered-out applications and relations can be hidden or made transparent, like in this example:
7. Reuse the Visualization template
Until now, we have entered data and created links, models, and views.
We will choose which icons we use to generate/visualize the data that form the views.
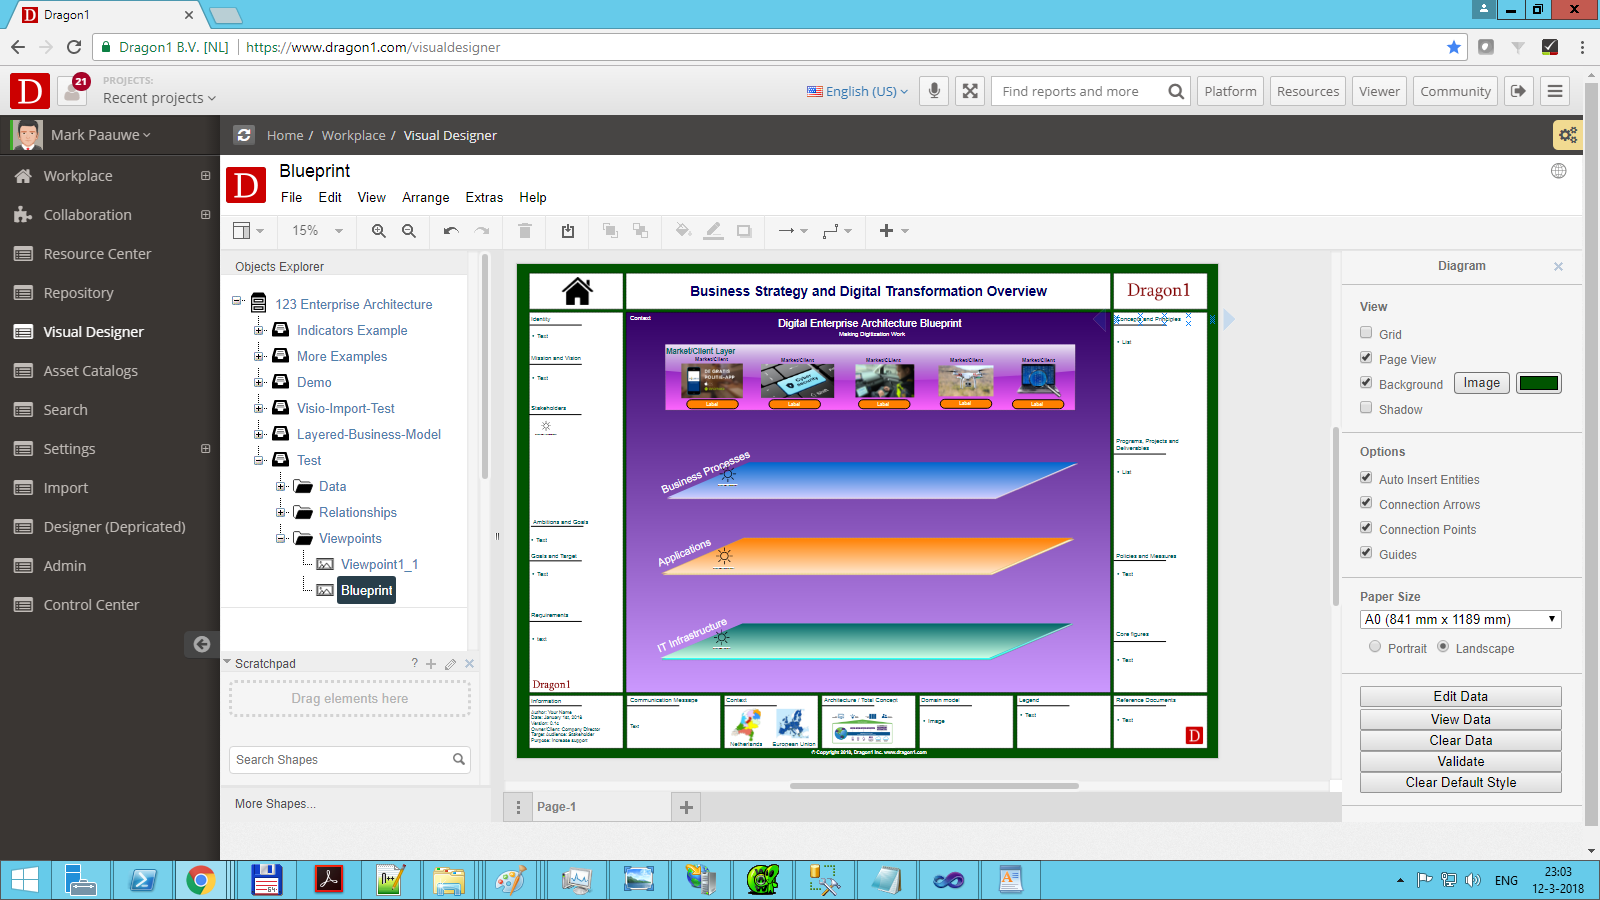
Below, you see the basic template available on Dragon1. The sun-styled icons are called Visual Items. These visual items are configured so that they know in what folders or models the data they should take and what icons they should use.
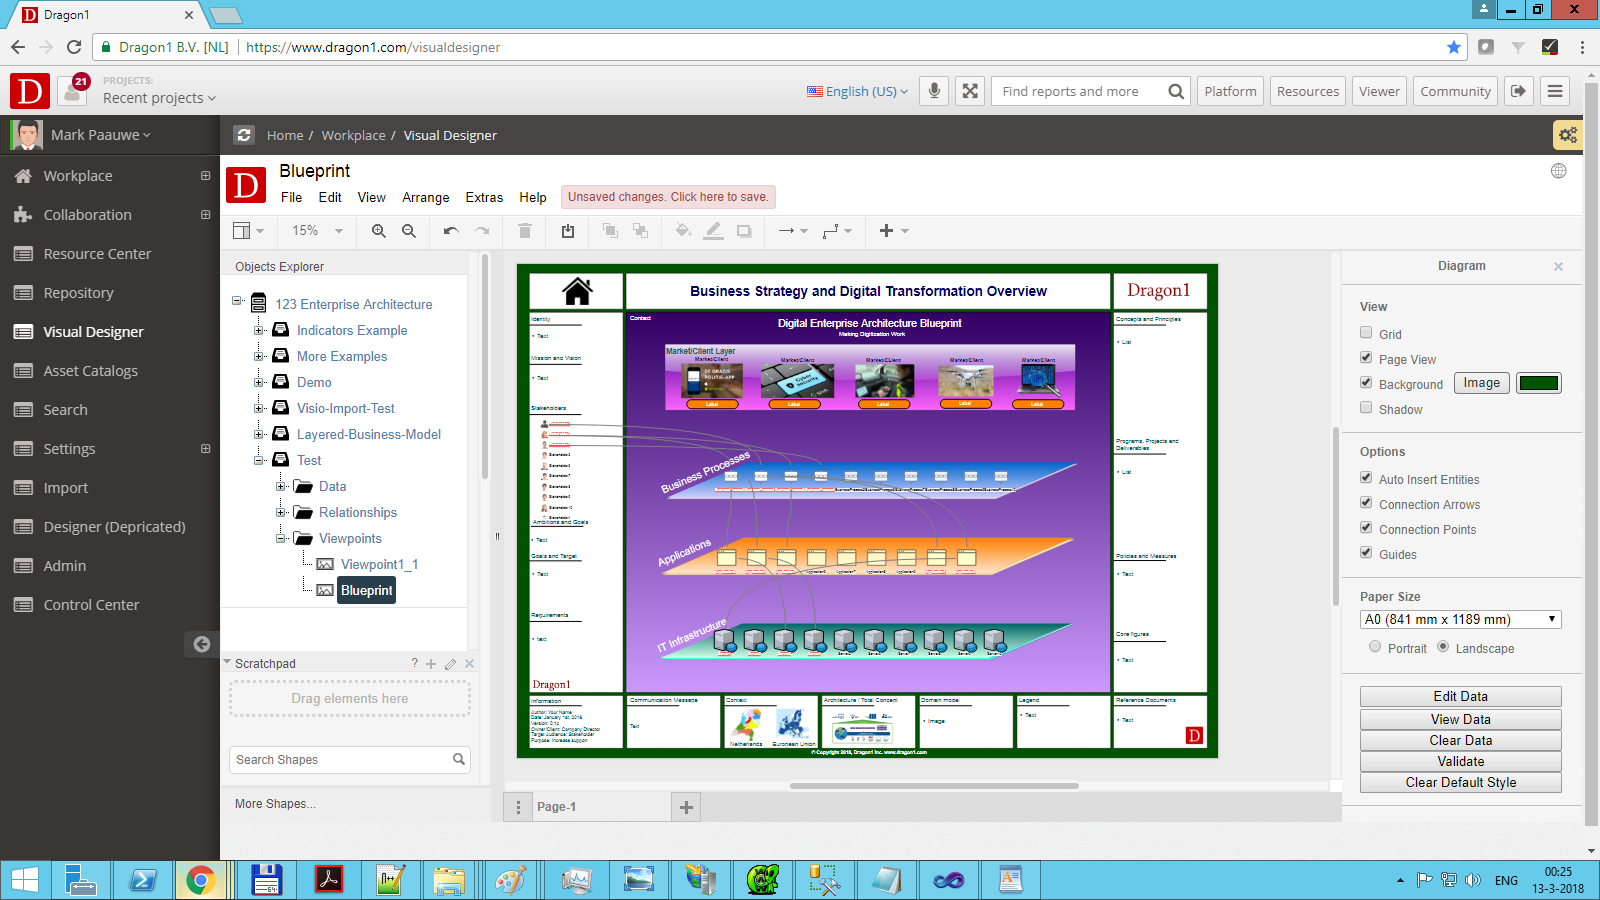
If this is all configured correctly, clicking View Data will cause Dragon1 to execute the rules in the visual items.
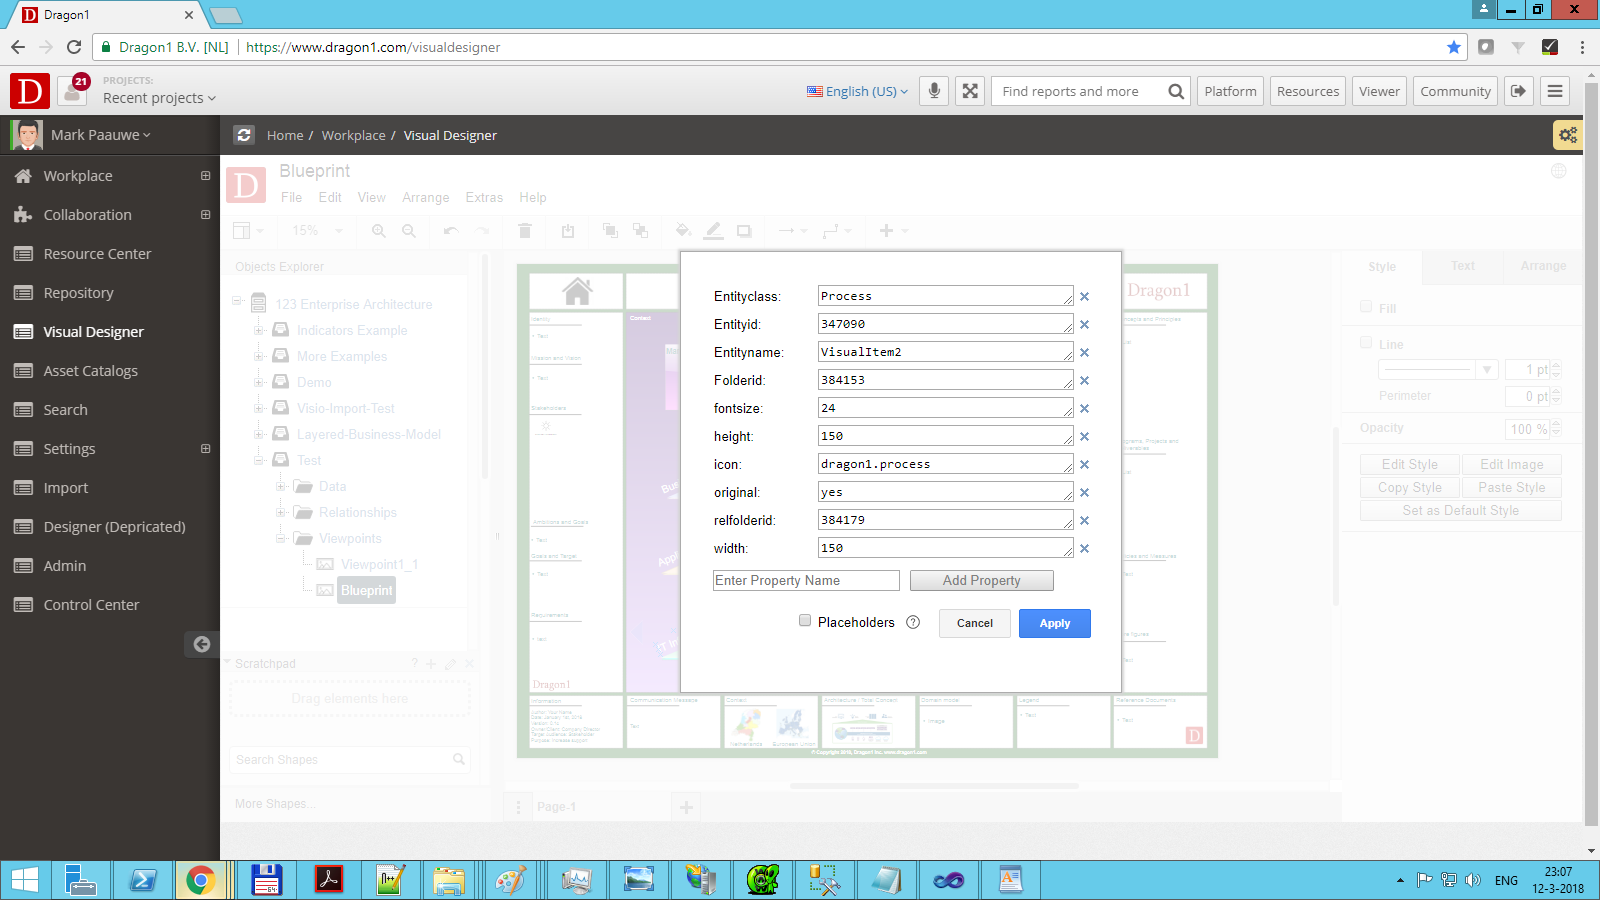
Below, you see an example configuration of a visual item:
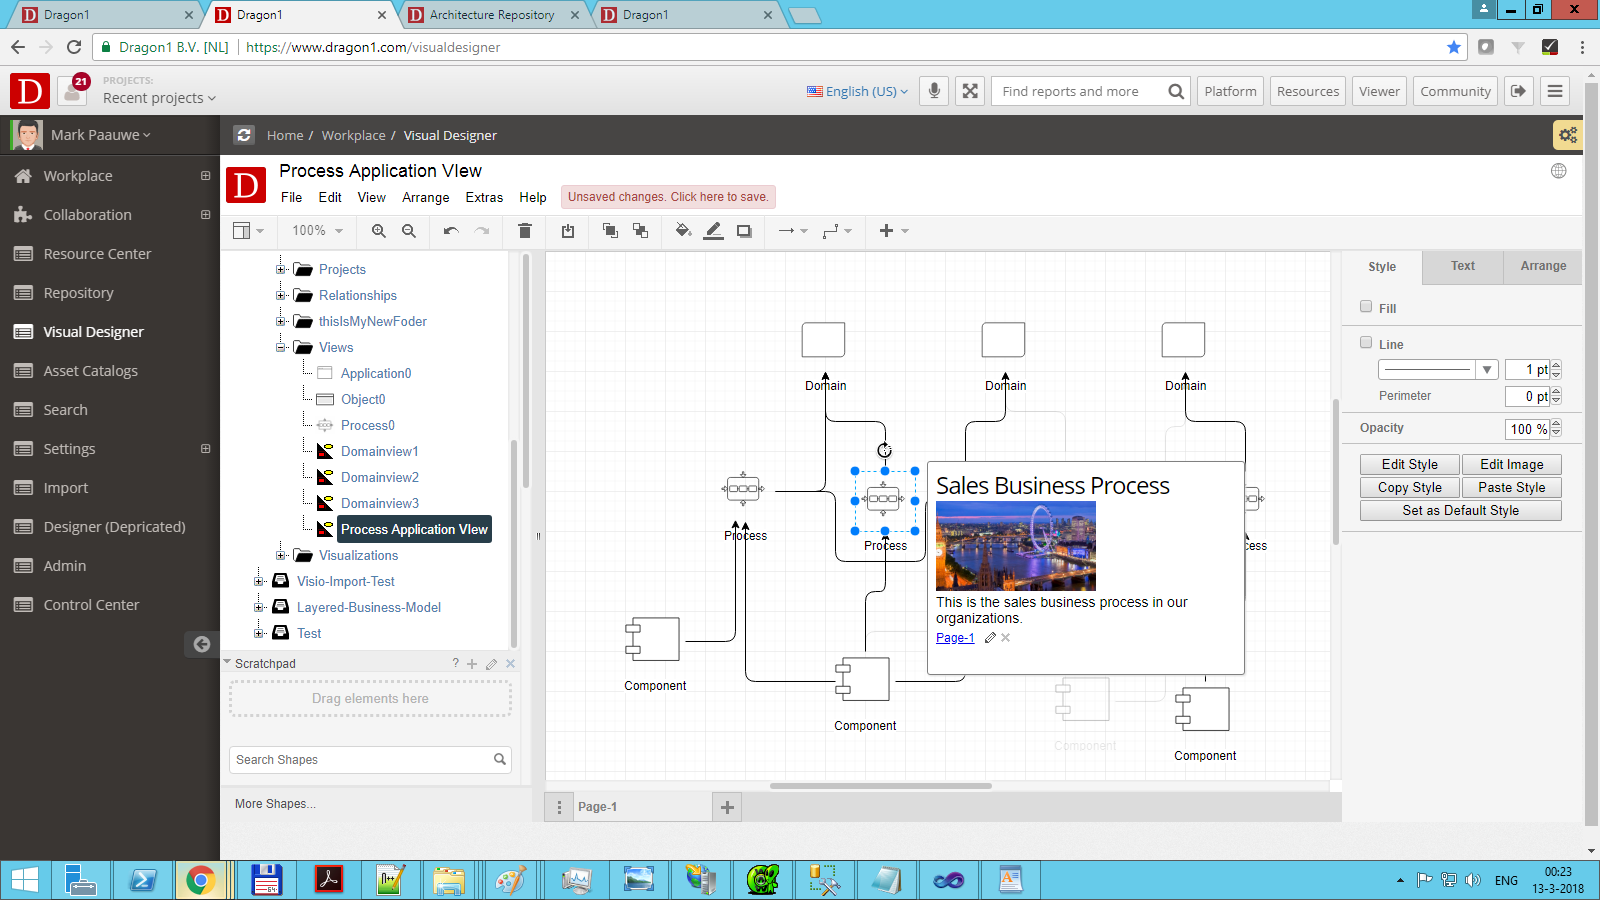
8. Create popup dialogs
9. Create click links to detailed visualizations
10. Publish the visualization in the Viewer
11. Use the visualization to project data and compare it with other models
Finally, the visualization is published, and you can use it to support your decision-making, such as leaving comments on it.


