Dynamic Views - Scenario 4: Grouping View
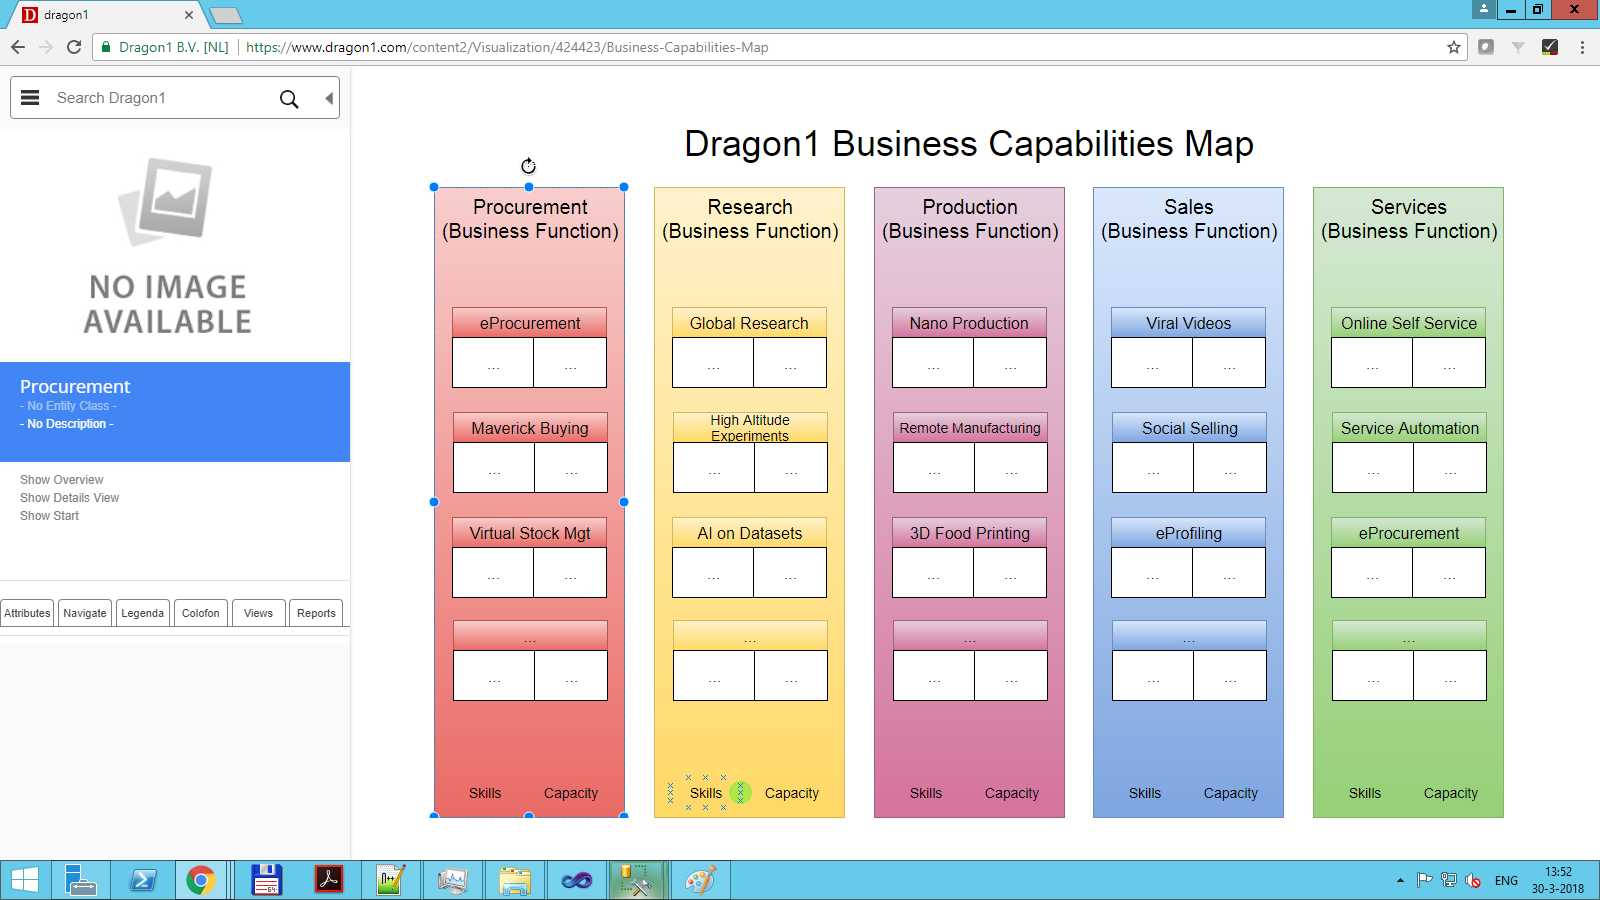
On Dragon1, you can create dynamic grouping views.
You can take, for instance, all the business areas from your organization and have the business capabilities that are or should become part of a certain business area visually be grouped in that area.
We will now provide all the steps to take for this scenario.
Step 1 - Enter Data
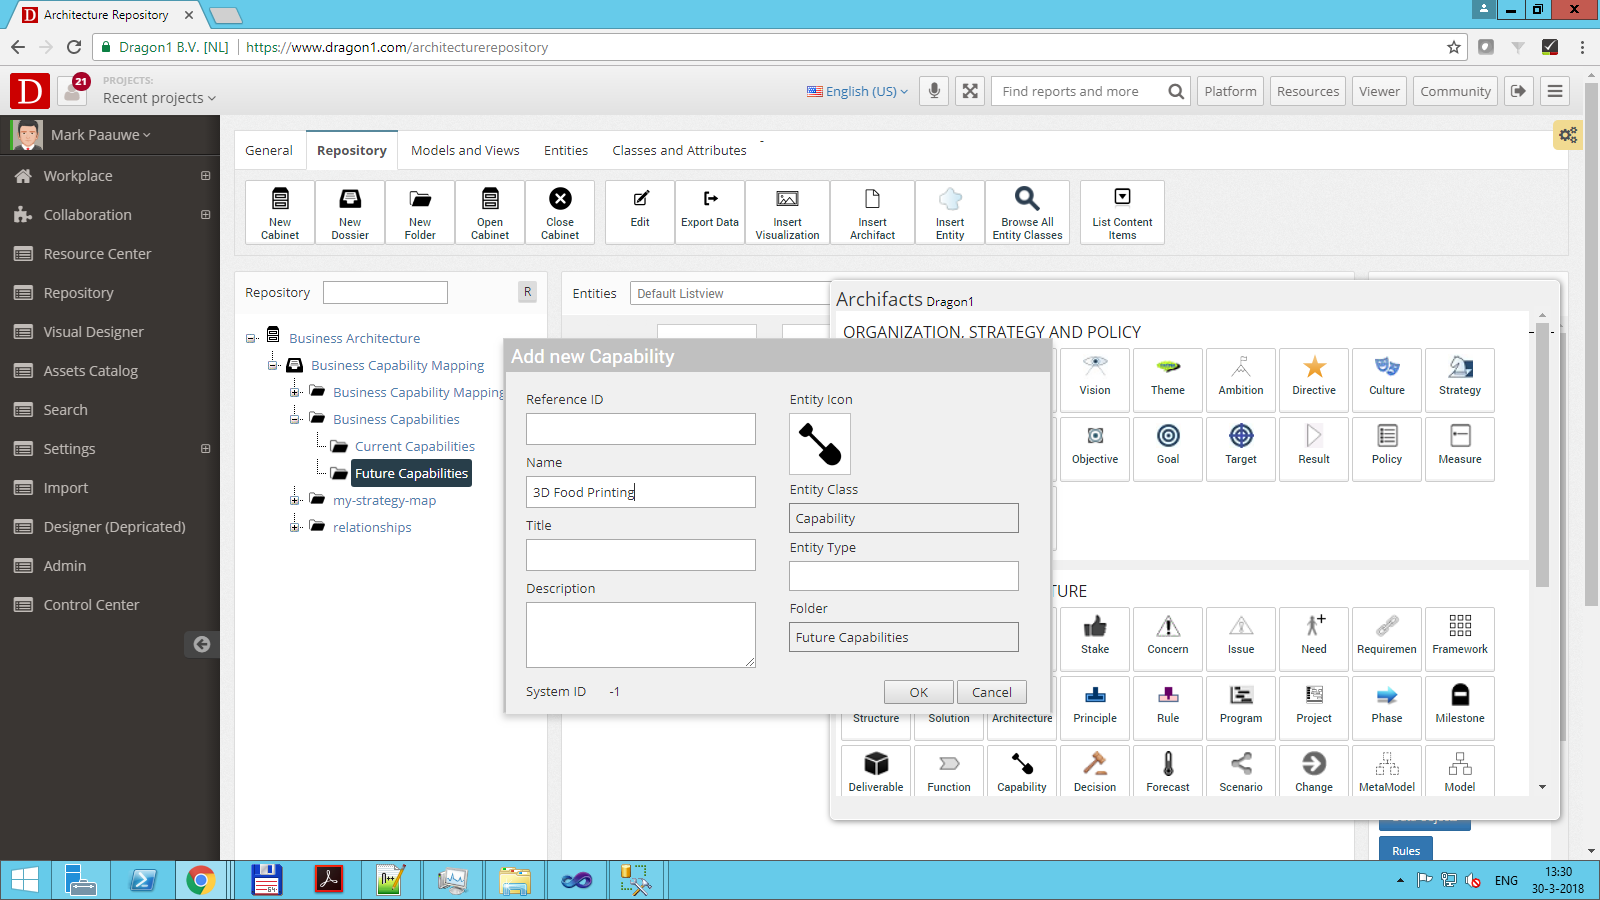
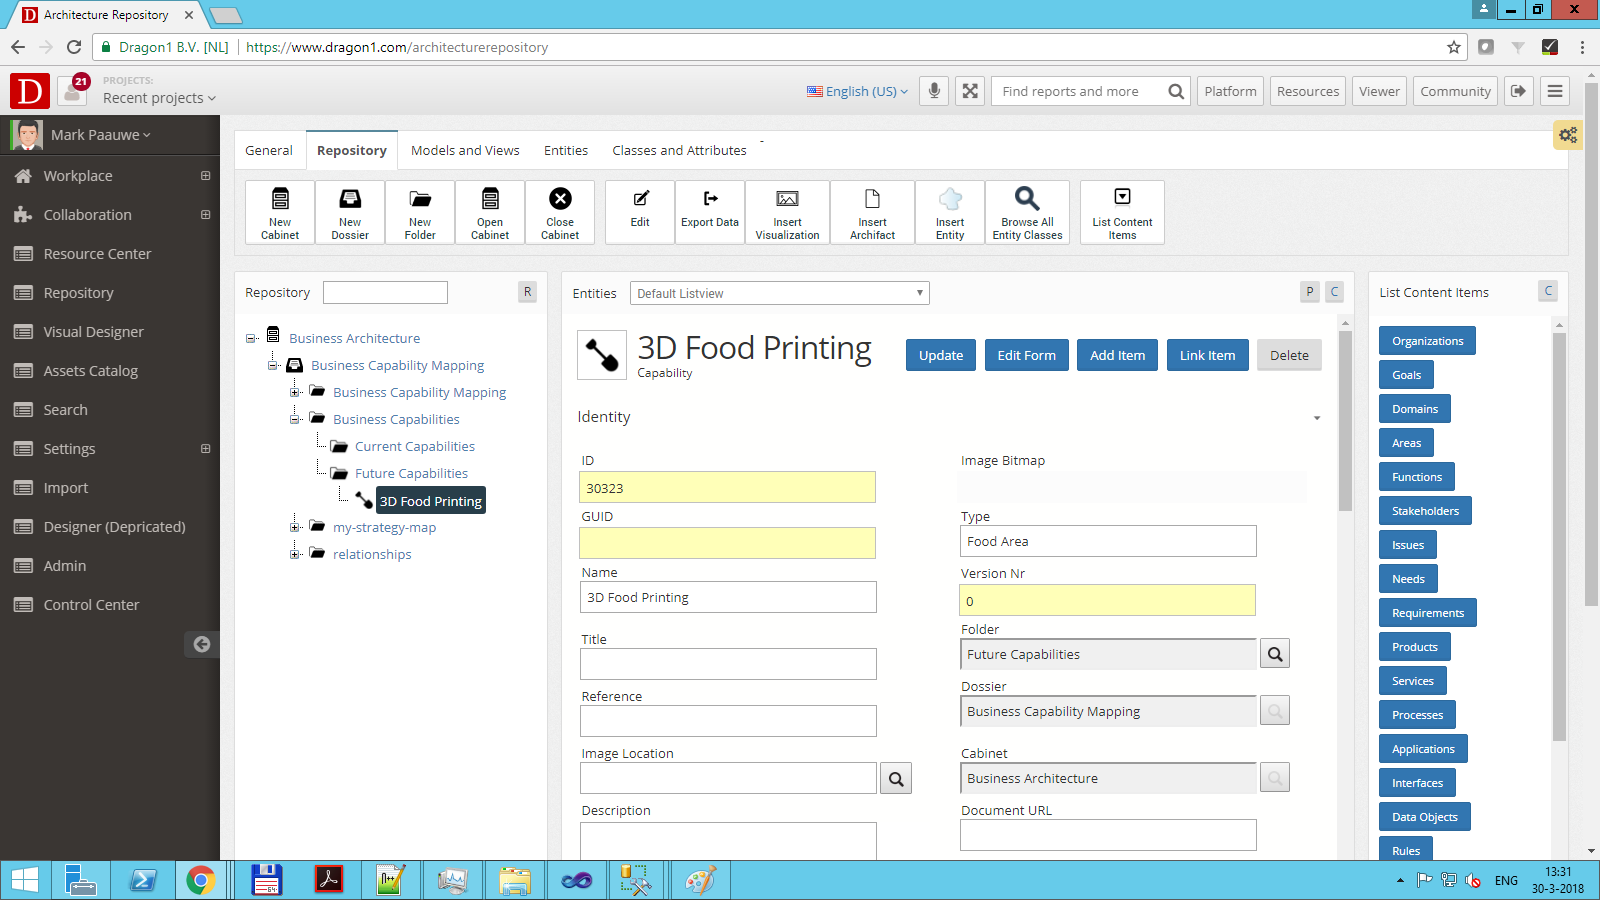
Go to the Architecture Repository and enter business areas and business capabilities as shown below:
Step 2 - Create Relationships and Create a Model
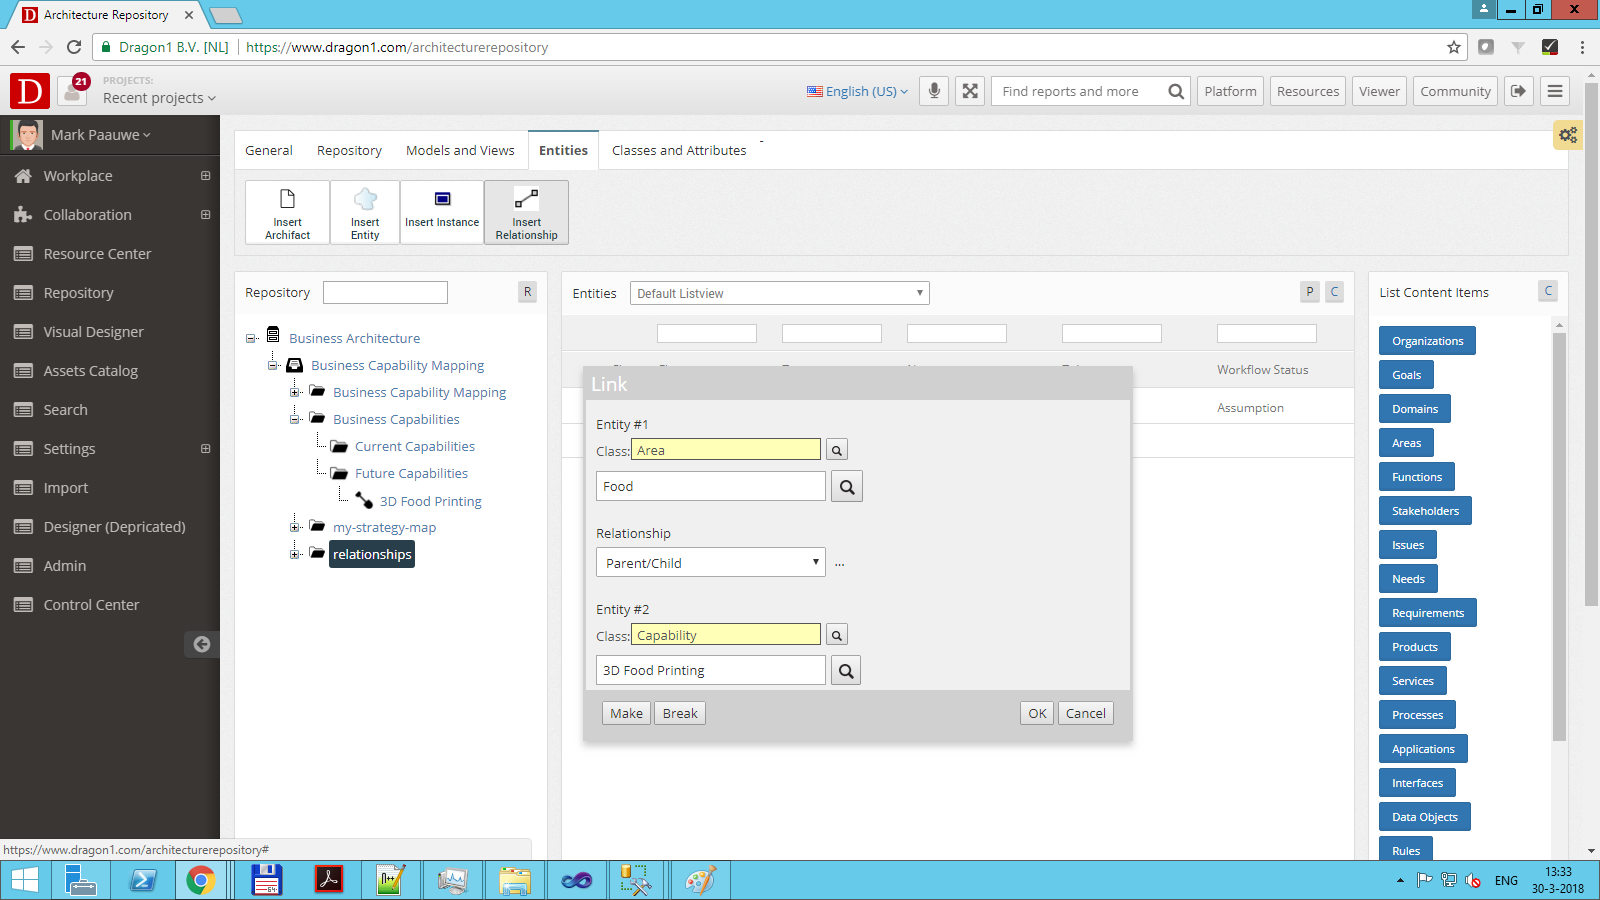
Next, create relationships between business capabilities and business areas.
You can do this in different ways. For instance, you can add the business areas as a type of business capability or create relationships to connect a business area to several business capabilities. Below, you will see how these two options work.
If you create a model (a bundle of relationships) in the Architecture Repository, you can link the created relationships to the model. How this is done is shown in the screenshot below.
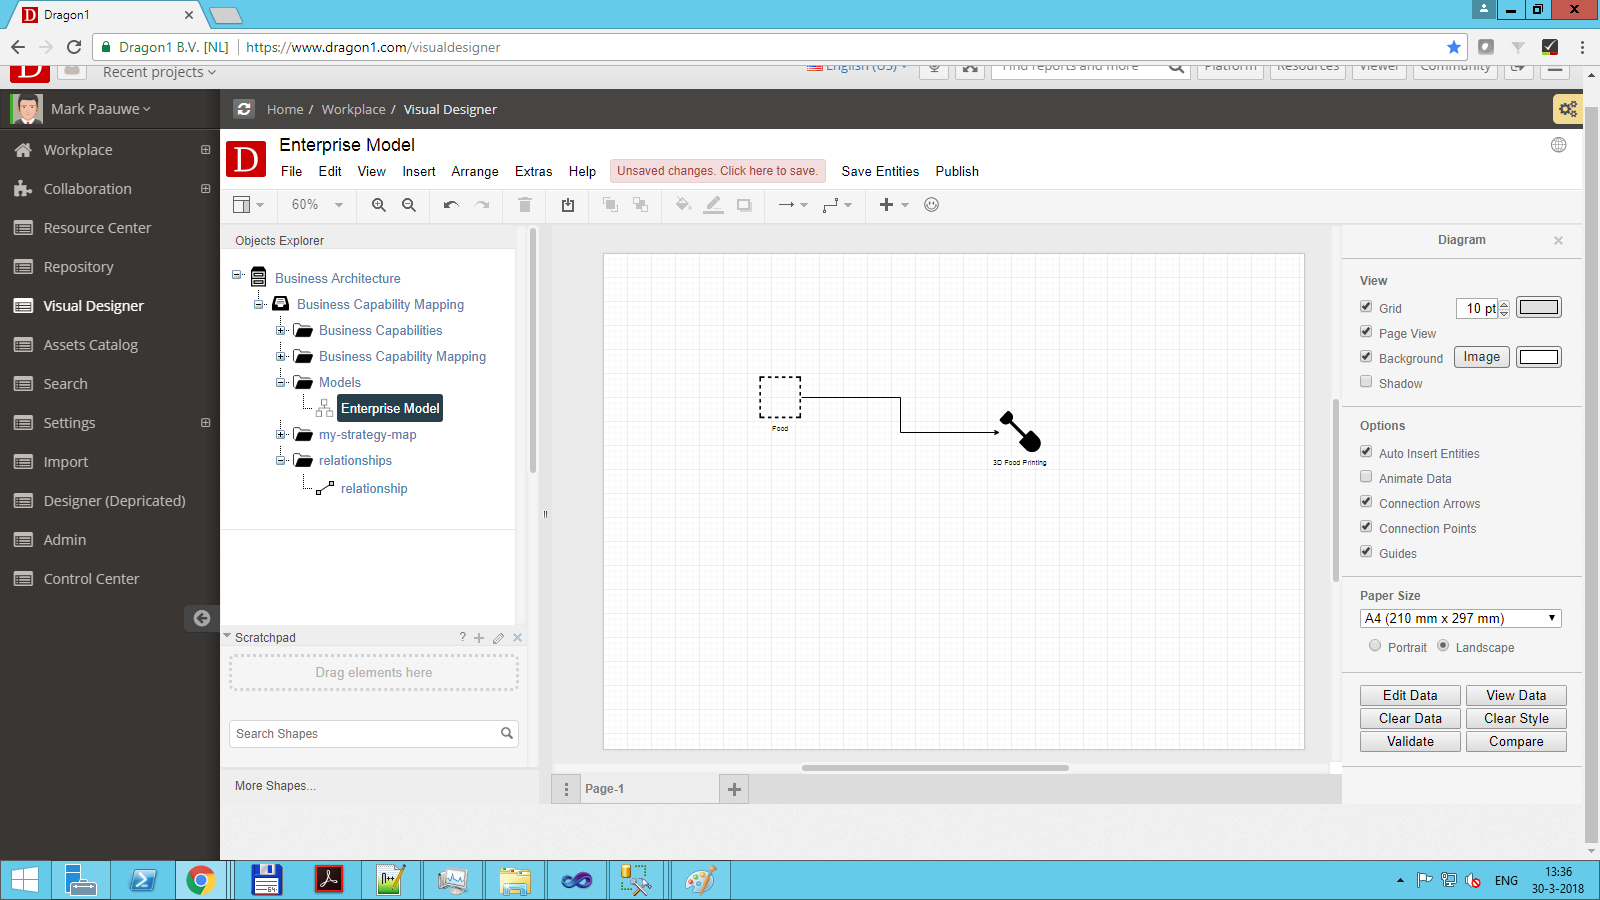
The model you have created can also be viewed in the Visual Designer. Also, you can create a model from scratch in the Visual Designer.
Step 3 - Create a View
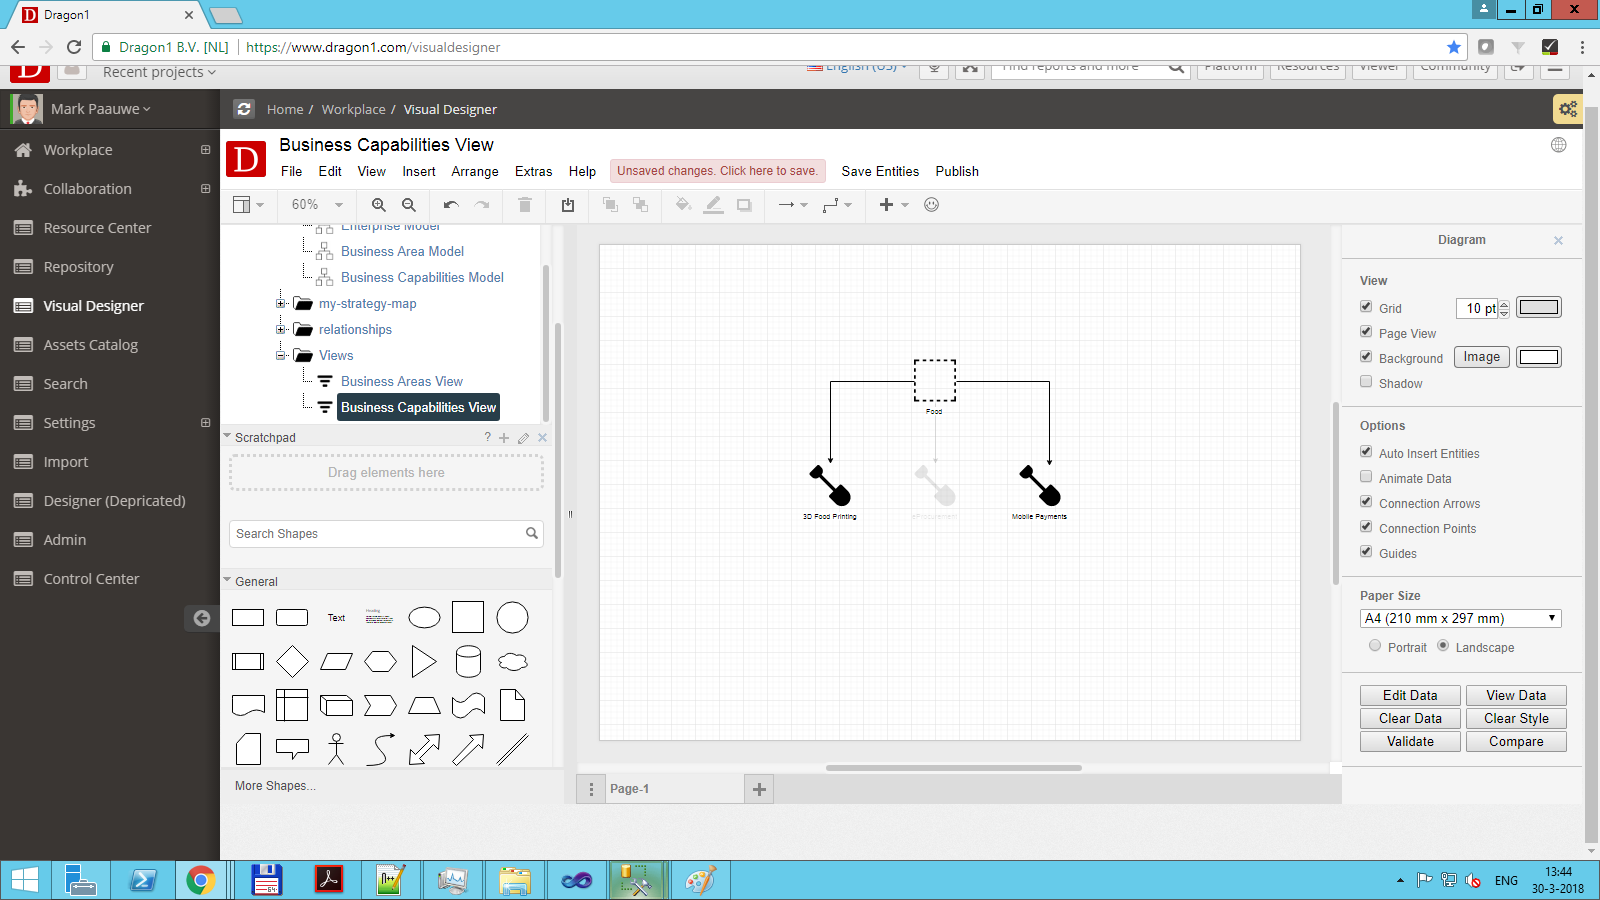
You may have more business areas or business capabilities per business area than you or the stakeholders want to see on the diagram. In this case, you can create a view (filter on top of a model) that only selects the data you want to show in the visualization.
You can use the attribute value of the business area to filter out data. For instance, you can create a view of business areas that only show the approved business area, or you can create a view of business areas that show the business areas of type Global or Local.
Step 4 - Create a Visualization
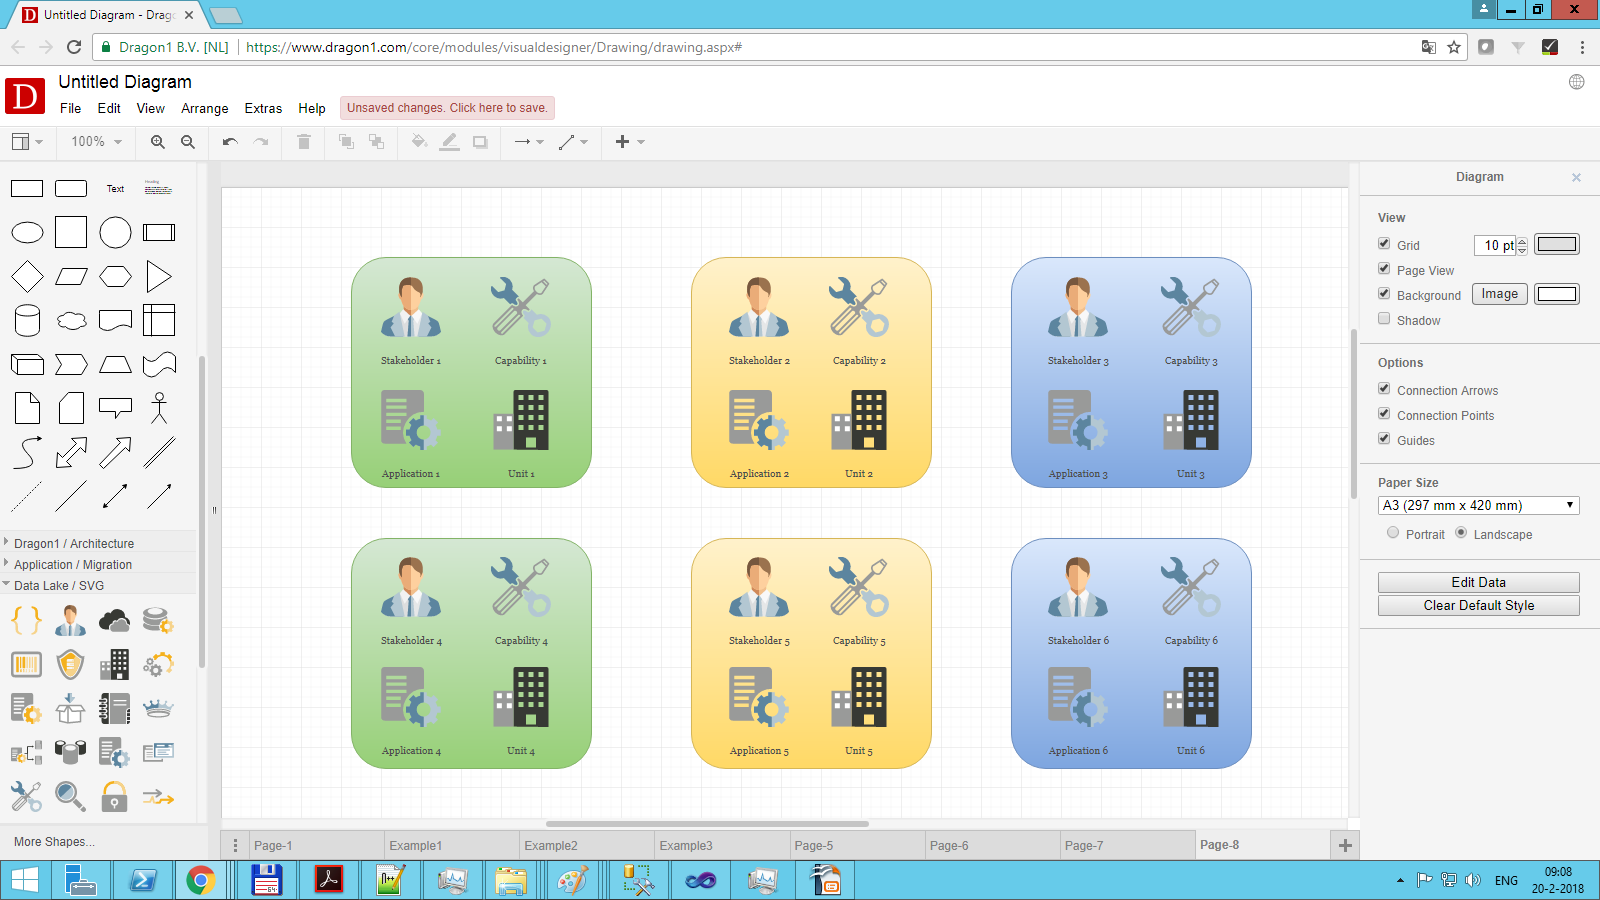
We now need a visualization canvas to drag, draw, and generate shapes.
You create a visualization in the Architecture Repository or the Visual Designer. You can choose to add a template or work with a blank sheet.
Step 5 - Setup Visual Items
You have come to the step to make the data, the model, and the view visible on a canvas.
You need to add Visual Items (shape/data placeholders) to the visualization. We only need two visual items: one to generate the business areas and one to generate the business capabilities inside the business areas.
Step 6 - Generate the Visualization with the View Data
When you are ready to do this, you can save the visualization and click on View Data (the button in the Visual Designer at the right bottom). Dragon1 will now generate your view.
If you like, you can print or export this generated view.
Step 7 - Publish the Visualization
Finally, you publish the visualization to the Viewer so it can be viewed and commented on by your stakeholders after they log in.
Here is an overview of all the dynamic view scenarios

