Essentials of Dragon1
Your first lesson is presented as a playground. Dragon1 automatically instantiates a template visualization for you in the Visual Designer. Log in, go to the Visual Designer, click on Open a Cabinet, and click on Playground.
Dragon1 lets you play and interact with the Visual Designer directly, and you will see the result immediately. Playgrounds (automatically generated visualizations) are great for learning, experimenting, and increasing productivity. This helps you to get up to speed on fundamental Dragon1 concepts.
Learning Objectives
At the end of the lesson, you will be able to:
- Start to work from the Digital Workplace
- Select Items in the Explorer Treeview of the Visual Designer
- Drag a shape onto the canvas
- Insert an entity in the repository
- Selecting a shape, showing smart tools
- Change the title of a shape
- Change the size of a shape
- Change the color of a shape
- Duplicate a shape
- Zoom in & zoom out
- Maximize the Drawing / Visualization Canvas
- Rotate a shape
- Create a connection between two shapes
- Change the connection attributes
- Write a title for your diagram
- Save a Visualization
- Print a Visualization
- Lock a Visualization
- Change the Z-order of shapes (to Front and Back)
- Place a shape in another frame
Start to work from your Digital Workplace
The starting place to work from is the Digital Workplace. You can go to the Workplace by clicking on the monitor icon. You will find that button in the top menu bar at the top right of your browser screen.
Select Items in the Explorer
If you visit the Playground (start the Visual Designer and open the Dragon1 Examples cabinet), you will see the expanded Dossier Playground folders.
You can do some things now: select a folder, expand a folder, or collapse a folder.
- Selecting a folder means: clicking on the folder name so it gets selected and Dragon1 shows the folder's contents.
- Expanding a folder means: clicking on the plus sign before the folder name. Only if it has child items will it have a plus sign. If you expand the folder, you will see what is in it. If you click on a visualization, you will see the visualization (in Edit Mode, which is explained later on).
- Collapsing a folder means: clicking on the minus sign to close a folder.
Next, select the visualization 'Basic Diagram Example', so we can explore some of the features of the Visual Designer.
Drag a Shape onto the canvas
If you have selected the visualization 'Basic Diagram Example', you see a couple of shapes on the canvas. You can change and print this visualization (or save it as a PDF).
Note: You cannot save the visualization because you are not the creator. If you try to save this visualization, you will see an alert box stating that you cannot save the visualization. You can access visualizations you did not create because these visualizations have been given publication status 'Published World Wide' by their creators.
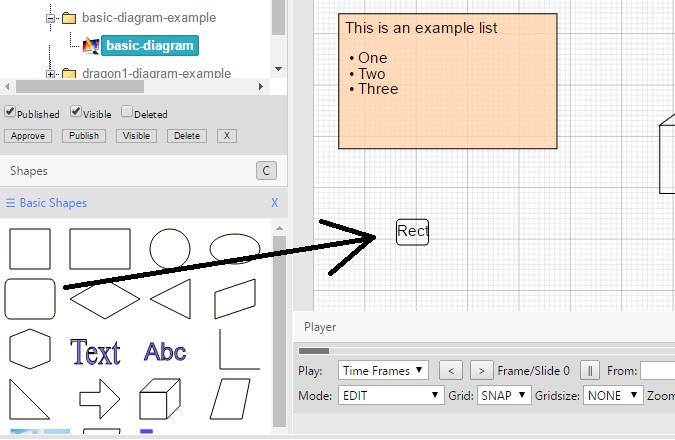
At the bottom left of your browser screen, you see some shapes in a panel. You can 'drag' shapes from the panel to the canvas. Please do this by clicking (mouse down) on a shape, dragging it to the canvas, and then letting go of the mouse button (mouse up). You will see that the shape has been added to the visualization. Also, the visualization is saved automatically right away. Wait for the alert box stating that the visualization is saved. In this case, on the Playground, it states that the visualization cannot be saved.
Insert an Entity of a Shape
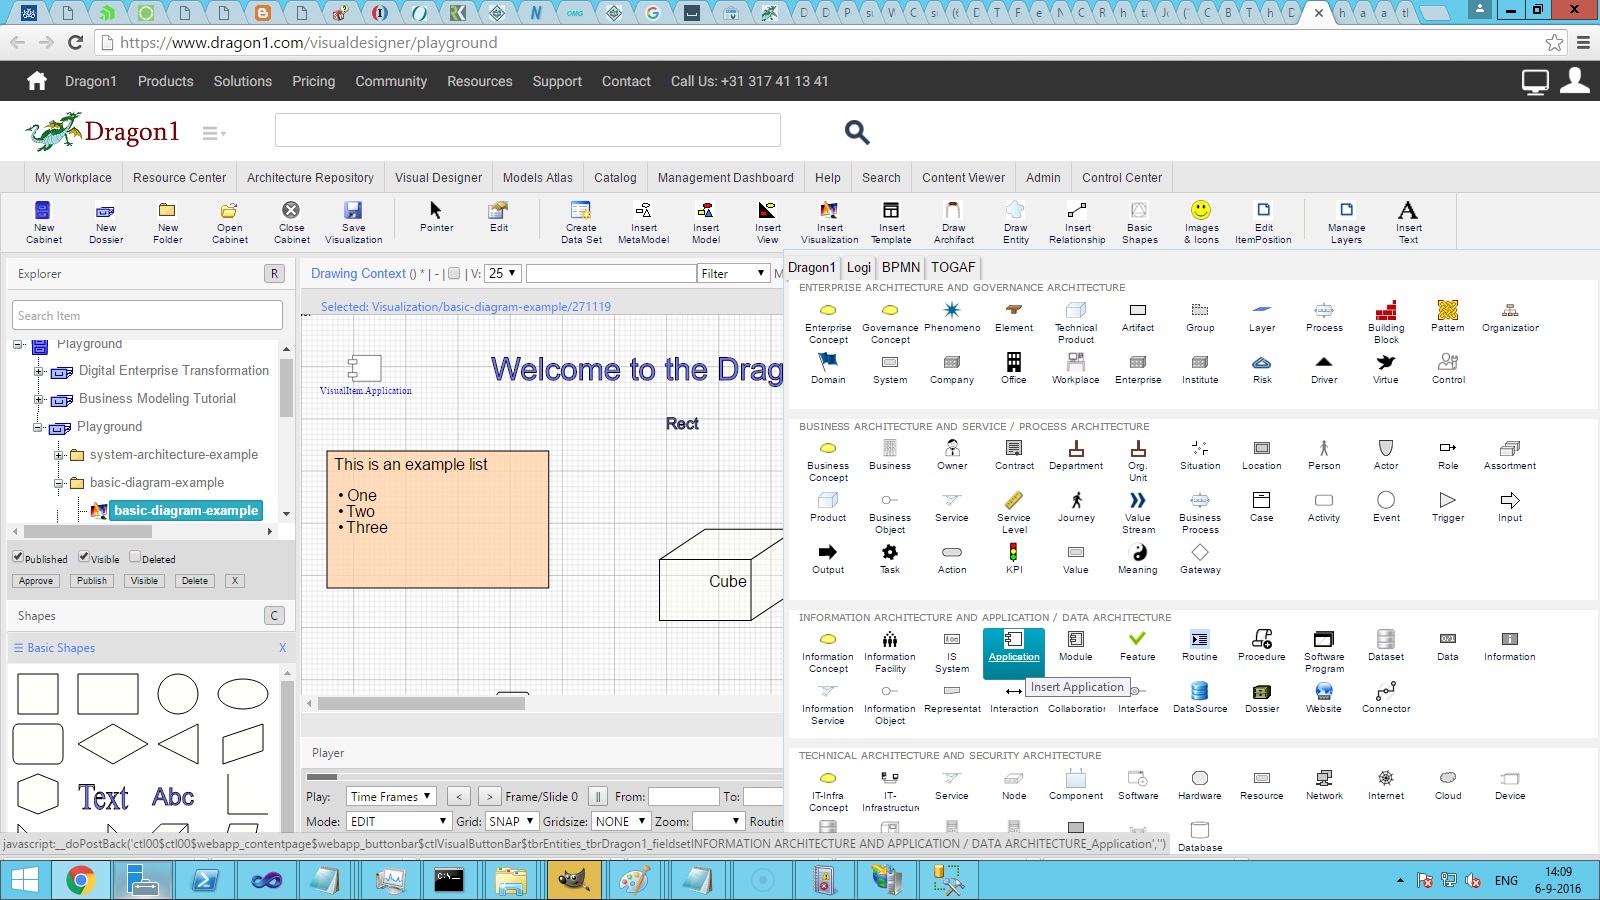
You can insert shapes via the button bar at the top of the screen, next to dragging. The screenshot below shows how we selected the shape 'Application' in the 'Draw Entity' dropdown menubar. By clicking the button, the shape is inserted on the Drawing Canvas of the visualization.
Selecting a Shape, Showing Smart Tools
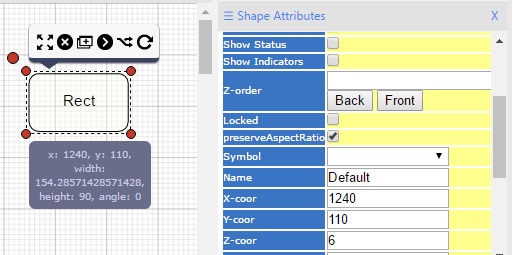
In the example, we have dragged a rounded rectangle 'Rect' onto the canvas. Now select 'Rect' by clicking on it. You will see smart tools appear around the selected shape.
These smart tools have the following functions:
- Resize
- Cut
- Copy
- Draw connection
- Copy with connection
- Cut all connections ('pair of scissors' icon)
- Rotate
In the screenshot below, you see how the pair of scissors icon appears when a shape is selected, AND the shape has one or more connections to other shapes.
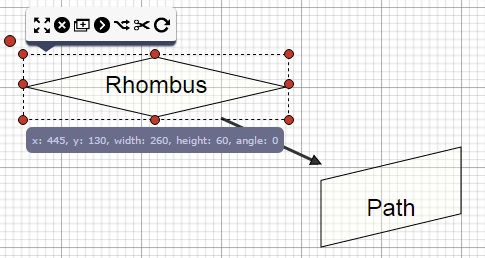
The pair of scissors icon appears when a shape is selected, AND the shape has one or more connections to other shapes.
In the Inspector on the right-hand side, you see a panel called 'Shape Attributes'. If you click on the word 'Shape Attributes', it will expand or collapse.
If you select the shape and click on Locked, the shape freezes. You can not (accidentally) change its position.
Change the Title of a Shape
Every shape has an internal name and an external title. The name of a shape is shown in the Explorer Treeview and can be used to refer to a shape. The title of a shape is, by default, shown at the bottom of a shape, but can also be positioned elsewhere.
To change the title of a shape:
- 1. Select a shape on the canvas
- 2. Expand the Text panel in the Inspector by clicking on the word Text Attributes
- 3. Move this panel to the top by clicking on the list icon if it's not already.
- 4. Type a text in the Title field and press TAB
Now you see the title of the shape on the canvas has changed. Be sure to save the visualization by clicking on 'Save Visualization' in the menubar. If you are the creator of this visualization, an alert will be shown stating that it is done.
Change the Size of a Shape
Every shape can change size, angle, and form. To change the size of a shape:
- Select a shape on the canvas. Now you can change the size in three ways.
- Use the crosshair smart tool to resize the shape
- Use the square selection markers to resize the shape
- Expand the Inspector Shape Attributes and type in a new value for the Width and Height of the shape.
In the Shape Attributes of the Inspector panel, you see the option of preserveAspectRatio. If you select the shape and check this option, resizing it will maintain its current aspect ratio.
Change the color of a Shape
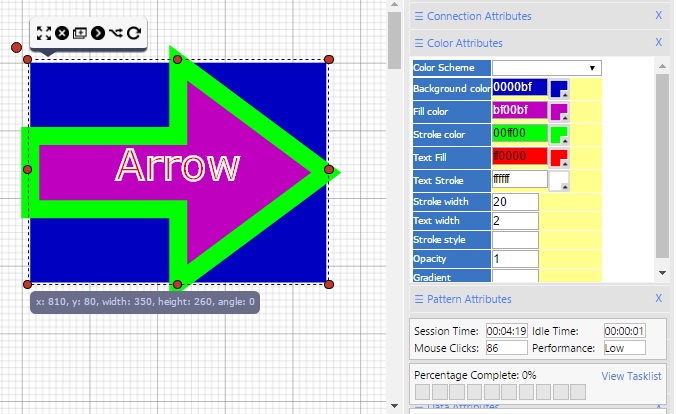
Go to the 'Color Attributes' in the Inspector panel. You can change the following colors here:
- The fill color of the surrounding shape
- The stroke color of the surrounding shape (means border color)
- The stroke width of the surrounding shape (means border width)
- The fill color of the text
- The stroke color of the text (means border color)
- The stroke width of the text (means border width)
- The opacity of the background (mean transparency)
If the shape color does not change automatically after using the Color Picker, go to the color selection field in the Inspector and press TAB while selecting the shape. Now the color should be changed.
Duplicate a Shape
To duplicate a shape, use the [+] from the smarttools around a shape when it is selected.
Zoom in & Zoom out
To zoom in or zoom out, use your mouse wheel. Remember the zoom factor when saving the visualization, model, and view.
Maximize the Drawing / Visualization Canvas
To maximize the drawing canvas:
- Click on the 'Drawing Context' link at the top left of the canvas
- Click the 'Drawing Context' link again to return to the default screen setup.
Rotate a Shape
You can rotate a shape using the rotation smart tool (the first tool on the bar) or the red dot at the top left of a shape once it is selected.
Create a connection between two Shapes
To create a connection (relationship):
- Select a shape
- Use the connection smarttool that appears around the shape
- Drag the connection to another shape
- Grab the point of your connection with the cursor hand open
- Drag the connection just over the border of the other shape
- Save the Visualization or Model
Change the Connection Attributes
To change the connection properties:
- Go with your mouse over a connection
- Click on the black wheel icon
- Expand the Connection Attributes panel
- Change the connection properties
- Save the visualization or model
Write a Title for your Diagram
To provide a title for your diagram:
- Select a Visualization
- Drag the ABC shape from your shapes panel onto the canvas
- Select the ABC shape
- Change the text in the title field of the Text Attributes panel in the Inspector
- Click Save Visualization
Save a Visualization
To save a visualization:
- Select a visualization
- Change something on the visualization
- Click on Save Visualization in the Button Bar
- Wait for the alert box stating that your visualization is saved.
Note: if you are not the visualization creator and the publication status is unpublished, you cannot save changes. Let the creator switch the visualization to published Private if you need to work together.
Print a Visualization
To print a visualization:
- Select a visualization in the Explorer Treeview
- Choose to disable the grid if you want to print the visualization quickly
- Click on the print link in the menu bar of the canvas
- Right-click the mouse in the opened window
- Follow the instructions of your browser
Lock a Visualization
To lock a visualization, select the Locked is YES value on the information TAB in the New Edit Dialog.
Change the Z-order of shapes (to Front and Back)
To change the Z-order of your shapes:
- Select a shape on the canvas
- Expand the Shape Attributes panel in the Inspector
- Click on the BACK or FRONT button
- Save your visualization or model
Place a Shape in another Frame (Slide)
To place a shape in another frame (slide):
- Select a shape on the canvas
- Expand the Shape Attributes panel in the Inspector
- Change the frame value in the dropdown list
- Save your visualization
- Use the control buttons on the player bar to switch between frames (slides)
The Printing Size of Shapes incorrect?
If the size of your shapes is incorrect in the print view, this is because your page size is not configured correctly. To solve this problem, change the size of your Page back and forth in the Inspector and save your model, view, or visualization.


