Create a Gap Analysis Matrix
Analyze the Size of Gaps in your Company
In this topic, you learn the basic steps of creating a Gap Analysis Matrix.
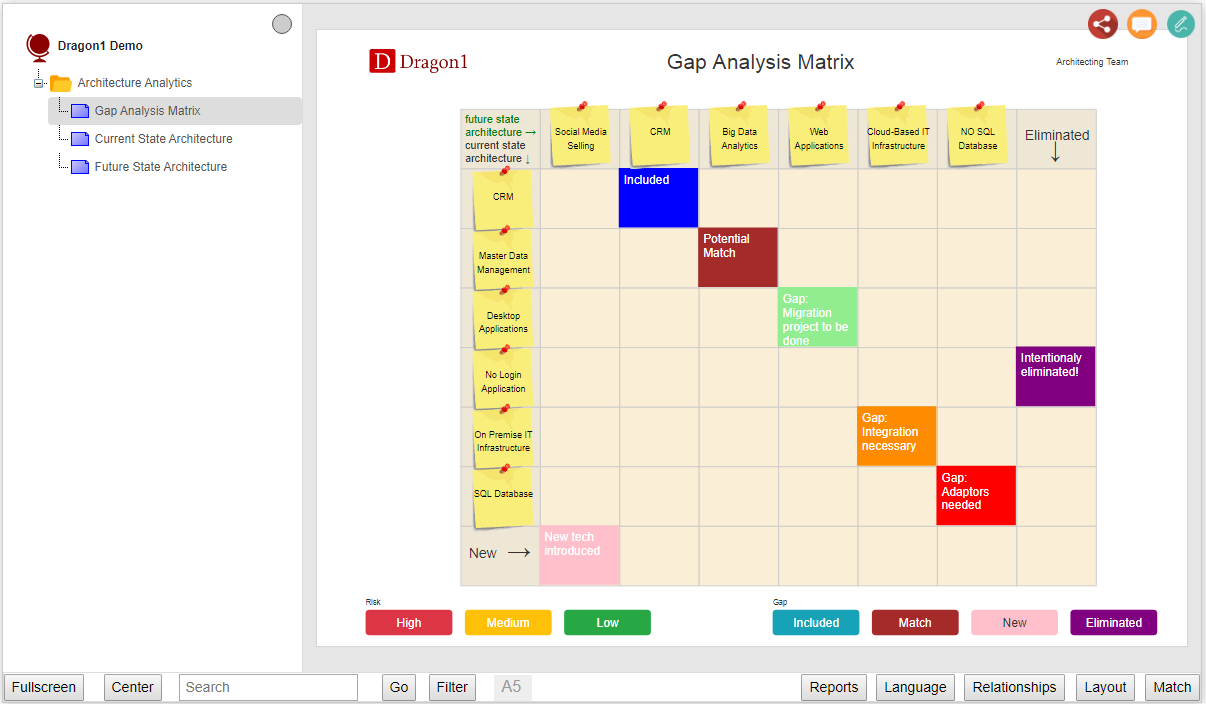
The Gap Analysis Matrix is a business analytics matrix for consultants and architects.
It is a visual map with an x-axis and y-axis and cells to record, measure, or describe the gap (distance) between two situations in an enterprise. For instance, the distance between a commercial department's current and future online sales capabilities.
This diagram is the perfect tool to help you analyze the size of gaps in a company.
This is an example Gap Analysis Matrix in the Viewer.
How To View a Gap Analysis Matrix
To view a GAM
- Go to the Viewer
- If you are logged in, you need to select 'show demos' in the Viewer, to see the template.
- Click on the Gap Analysis Matrix template
- You see an interactive/clickable Gap Analysis Matrix generated from a .dragon1 file.
- Click on a post-it shape in the diagram to see the details of the item you clicked on at the left.
- Click on the buttons at the bottom of the matrix to do analytics on the diagram.
- Click on the Filter button at the bottom button bar to hide certain items.
- Also, try dragging some items on the diagram.
- As a user, you can choose to work with data in a repository or with data in a file
Download and View the .dragon1 File
Dragon1 offers you to work file-based (JSON structured) and repository-based (in a SQL Server database management system).
The example above has the data in a .dragon1 file. A .dragon1 file is JSON structured on the inside.
To download and view this GAM template file:
- Click the link to download the Gap Analysis Matrix.dragon1 file containing the gap data.
- You can open the file in any text editor, like Notepad.
- Click on the filename in the download bar at the bottom of your browser. You now see the .dragon1 File text opened in Notepad or another attached text editor to the file open event.
- Edit or change the title value and team value of the visualization in the file
- Save the modified .dragon1 File in a folder on your computer
- To view your edits, go to the Viewer again (If you are logged in, you need to select 'show demos' in the Viewer, to see the template)
- Click on the Upload .dragon1 File button at the right top of the Viewer
- Select your file from your computer and open the file
- Now you see your modified Gap Analysis Matrix in the viewer
- NOTE: You need to be logged in to be able to save changes in a .dragon1 file or the repository.
Data Structure
The data structure of the gap matrix is as follows:
- Data objects for the x-axis of the diagram
- Data objects for the y-axis of the diagram
- A model to relate the data objects
- Relationships, as parts of the model, define the gap between data objects.
- Definition of data objects for the X-axis and Y-axis
- Names for the labels of the X-axis and Y-axis
- Definition of the buttons at the bottom of the diagram (this is optional)
Below is an excerpt of the JSON file showing the data structure for one gap
You can see this JSON code yourself when you click on the code button in the Viewer in Edit Mode.
...
{"class":"Model","id":"3","name":"Stateless Enterprise Model"},
{"class":"Concept","type":"Application","id":"3","name":"Desktop Applications","startdate":"01 jan 2022","enddate":"31 dec 2022","importance":"operational","modelid":"1","group":"3"},
{"class":"Concept","type":"Application","id":"11","name":"Web Applications","startdate":"01 jan 2022","enddate":"31 dec 2022","importance":"operational","modelid":"2","group":"3"},
{"class":"Relationship","id":"3","modelid":"3","sourceclass":"Concept","sourceid":"3","targetclass":"Concept","targetid":"11","type":"Gap","text":"Gap: Migration project to be done","risk":"low"},
...
How To Create a Gap Analysis Matrix
You can create a matrix in the Viewer (in edit mode) or via the Data Dashboard.
We will first describe the viewer way in edit mode.
To create a Gap Analysis Matrix:
- Go to the Viewer
- If you are logged in, you need to select "show demos" in the Viewer to see the template
- Click on the Gap Analysis Matrix template
- Select the empty Gap Analysis Matrix Canvas page in the atlas
- Click on the Edit button (in the button bar below)
- Click on the Clip Art menu item (at the right top of the shapes toolbar)
- Now you can drag Post-it shapes onto the canvas
- Be sure to drag at least two shapes to the canvas and create (draw) a relationship between them via the toolbar at the top-right of the shape. (In the background, you create a model linked to this visualization.)
- Click on one of the Post-it shapes. On the left side of the canvas, click on the name of the shape. Now, you can edit the name.
- Press TAB or click next to the input field to update the name of the shape in the visualization
- Click on the Browser button
- Select the added shape (f.i. picture)
- Add a property in the 'tags' field
- Fill in “Current State” or “Future State” as tags value. This makes the Post-it positioned at the matrix's left or top.
- Press TAB and click on the OK button.
- If the Viewer does not update your visualization automatically, click in the treeview at the left to refresh your visualization (if your left panel is covering the treeview, collapse it by clicking on the arrow-left icon)
- You can also add any other shape from the icon bar at the right to the canvas. Based on the type 'property value,' they are positioned on the canvas.
- To define the color and text of the Gap, click on the Browser button
- Click on the checkbox to view the relationships.
- Select the newly added relationship (they have the name Gap relationship)
- Enter one of the following values in the text property: Included, Match, New, Eliminated
- To delete a shape: click on a shape in the diagram and click on the cross in the smart tools menu with the shape
- NOTE: You need to be logged in to be able to save changes in a .dragon1 file or the repository.
You have created a Gap Analysis Matrix in a .dragon1 file.
If you want to be guided by a chatbot in creating a gap analysis matrix, click the Chatbot button.
Create a Matrix with the Data Dashboard and Repository
To create the Matrix:
- Log in.
- Go to the Data Dashboard via the collaboration menu item.
- Follow the instructions to create an atlas
- Follow the instructions to create an atlas page. Link the atlas page to the atlas
- Follow the instructions to create a model
- Follow the instructions to add data objects like capabilities, concepts, applications, or processes in the repository.
- Follow the instructions to create relationships with which you define the gaps. Enter a clear text that describes the gap.
- Follow the instructions to create a visualization and select the Gap Analysis Matrix. Link the visualization to the atlas page
- Link the model to the visualization
- Setup the visualization template by defining labels for the axises
- Setup the visualization template by defining data objects for the axises
- Setup the visualization template by defining the optional filter buttons for the diagram
- Go to the Viewer
- Select the created atlas
- View your gap matrix
Interesting Things to Discover
Discover more pages to help you discover interesting things you can do with Dragon1 software.