Measure, Analyze and Improve
Gain insight through the reports
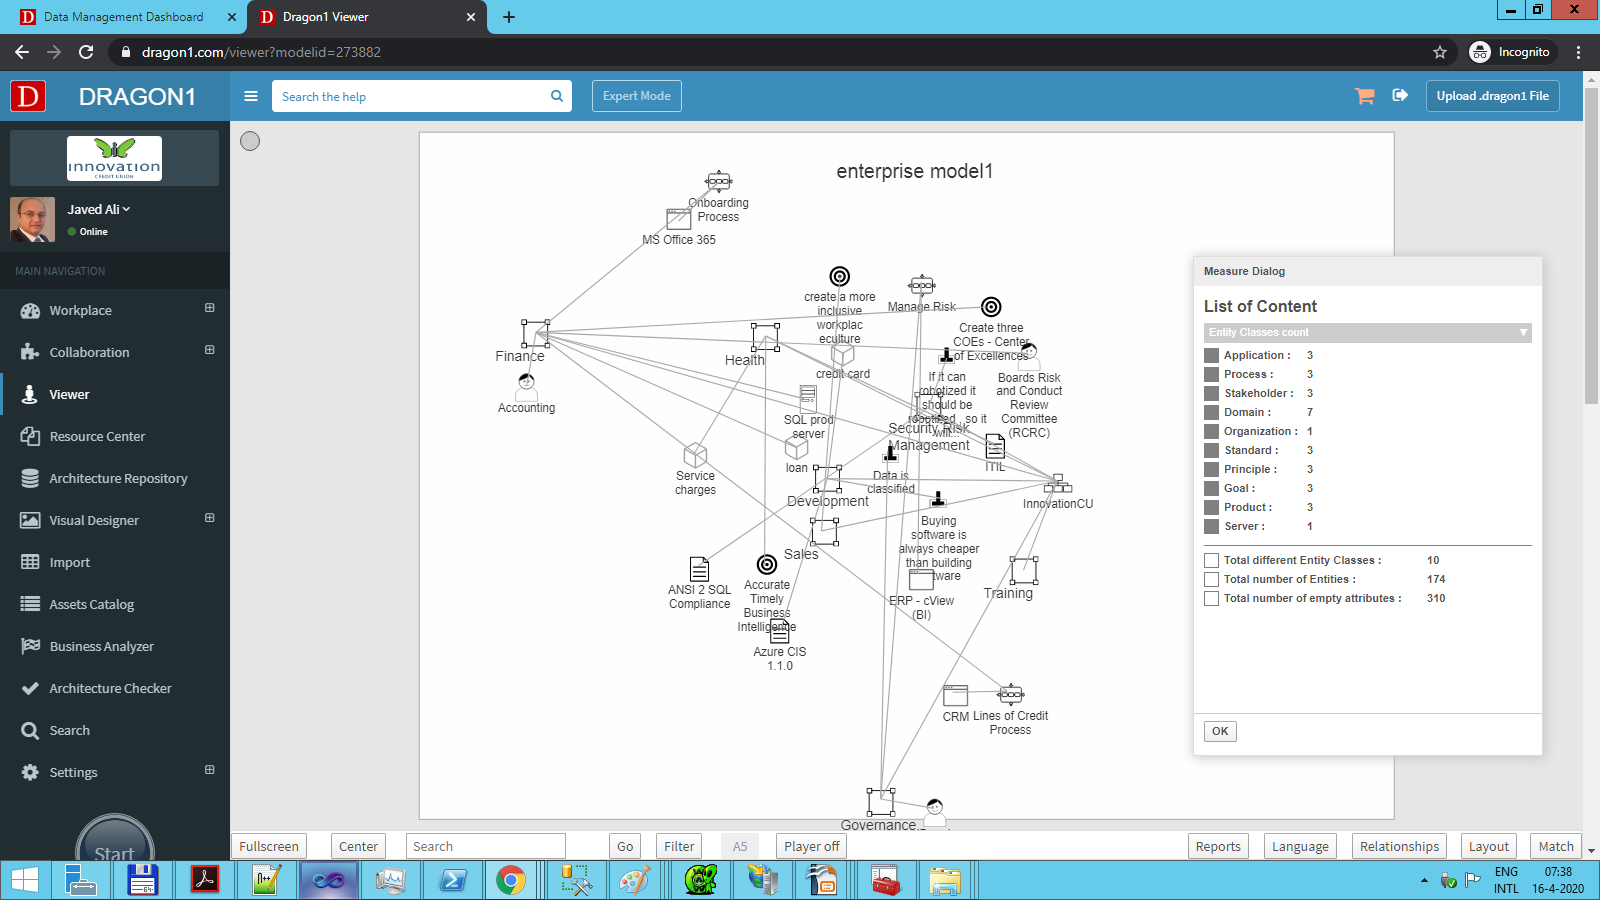
One of the most powerful features of the Dragon1 Viewer is the option to measure, analyze, and improve the models that have been created. These options can be found by pressing the 'Reports' button inside the Viewer. Once pressed, a Report Dialog is presented in which the following options are presented:
- Measure Diagram
- Analyze Diagram
- Improve Diagram
Measure Diagram
By choosing for Measure Diagram, a total and a detailed count is performed on all Entity Classes inside the model. The entities used are shown in a list with a count behind them. The Entity Class will be shown or hidden by clicking an Entity Class in the list. By showing or hiding certain Entity Classes, new insights can be gained.
Analyze Diagram
Measuring a Diagram is a good first step in gaining insights. However, the measurement does not indicate anything about the compliancy of the Model, in other words: 'Are the rules inside the model respected?'.
When opening the Analyze Dialog, a rule can be picked; by pressing the Analyze button, the Entity Classes inside the Diagram are highlighted in different colors.
- Violation
When the Entity Classes light up in a RED color, the selected rule is violated. - Partial Match
The Entity Class turns YELLOW if it complies with some of the rules. - 100% Match
GREEN means that the Entity Class is fully compliant with the selected rule. - Not enough data
In the case of the Entity colors BLUE, the analyzer could not verify if the Entity Class was compliant. Usually, this is caused by a lack of metadata.
Improve Diagram
The most powerful option is the Improve Diagram option. Dragon1 can generate an Action Plan containing the appropriate actions needed to resolve the rule violations shown in the Analyze Diagram Dialog.

