Web Application: Viewer
Manage with Architecture Visualizations
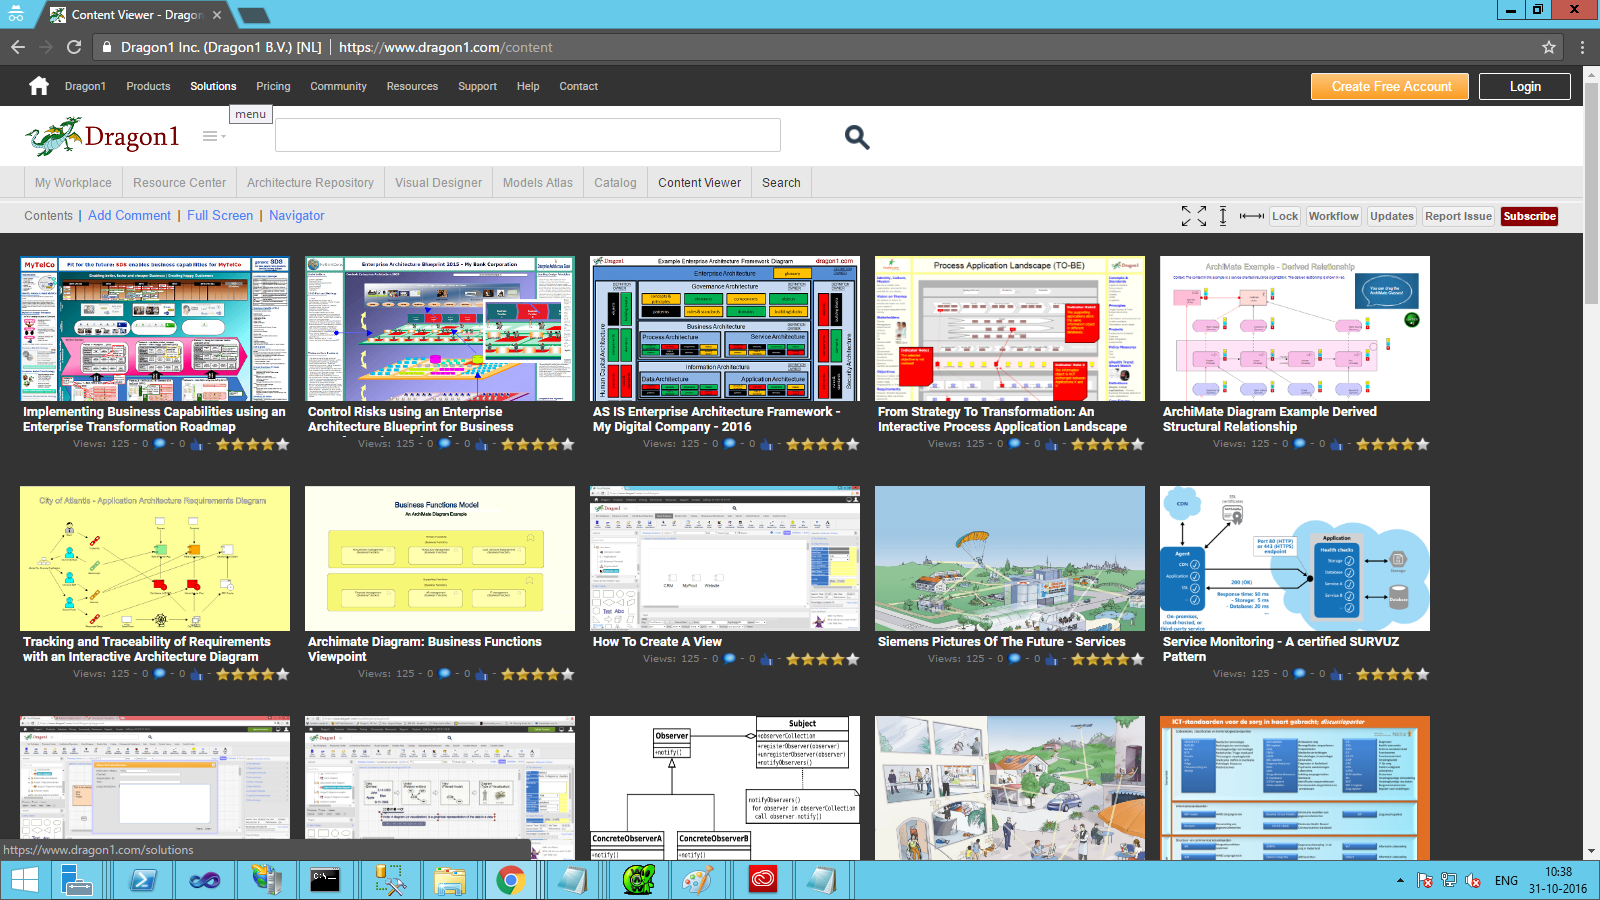
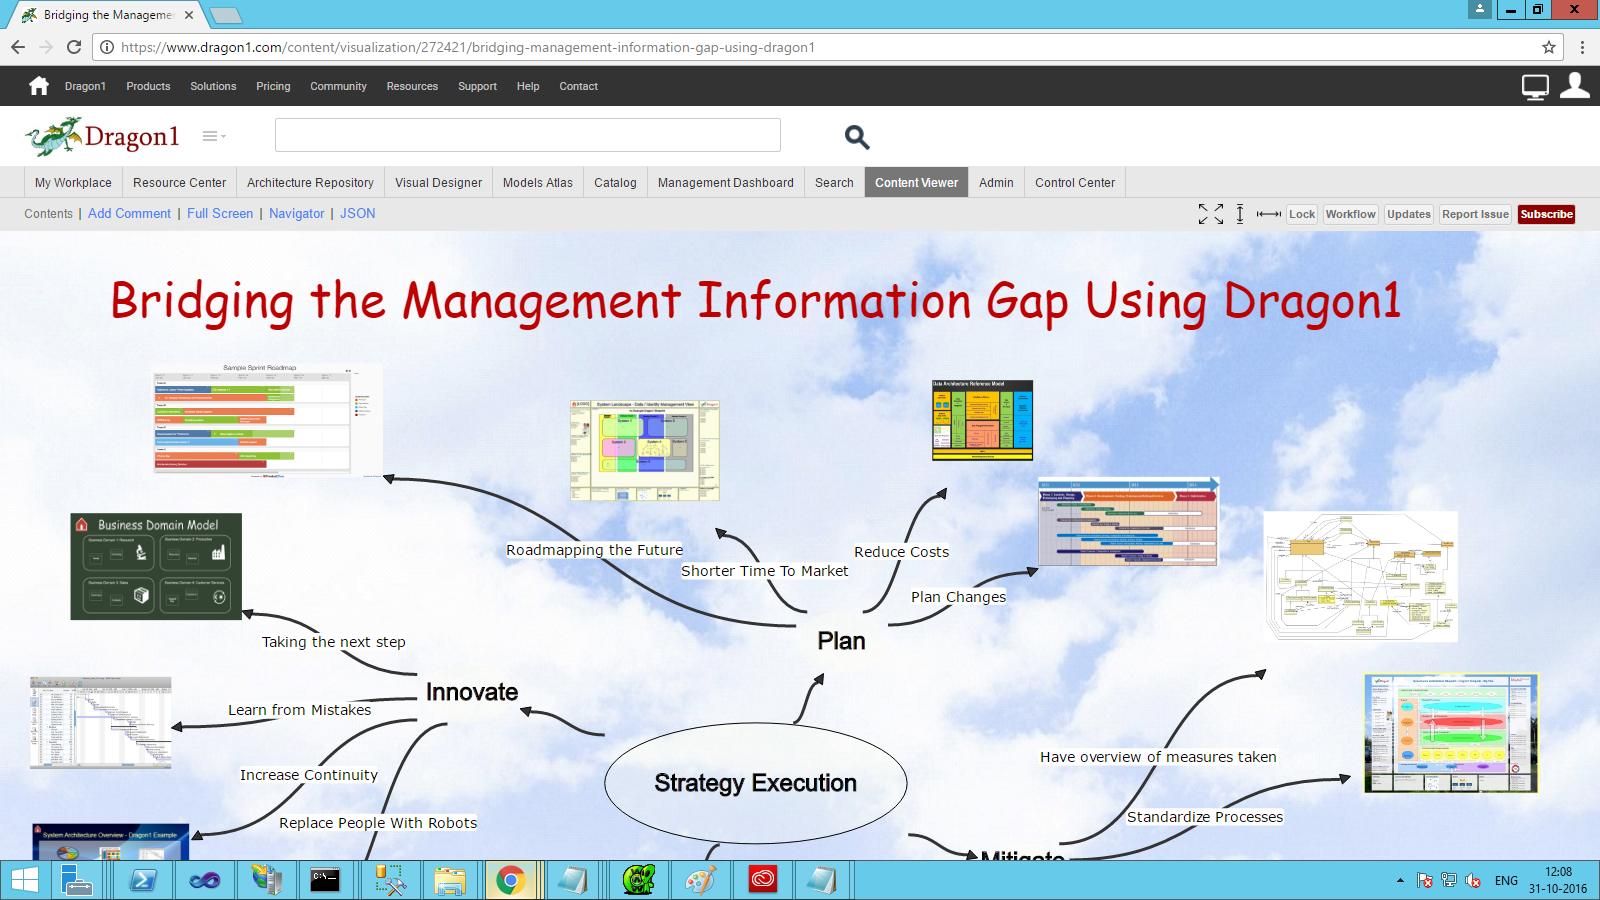
The Viewer is the web application on the Dragon1 platform that any stakeholder uses to view the published architecture visualizations.
With the Viewer, the stakeholders can manage and guide transformations and projects.
Here is the link to the Viewer. Be sure also to watch the interactive atlases, EA dossiers, frameworks, and standards on your Tablet PC and your Smartphone.
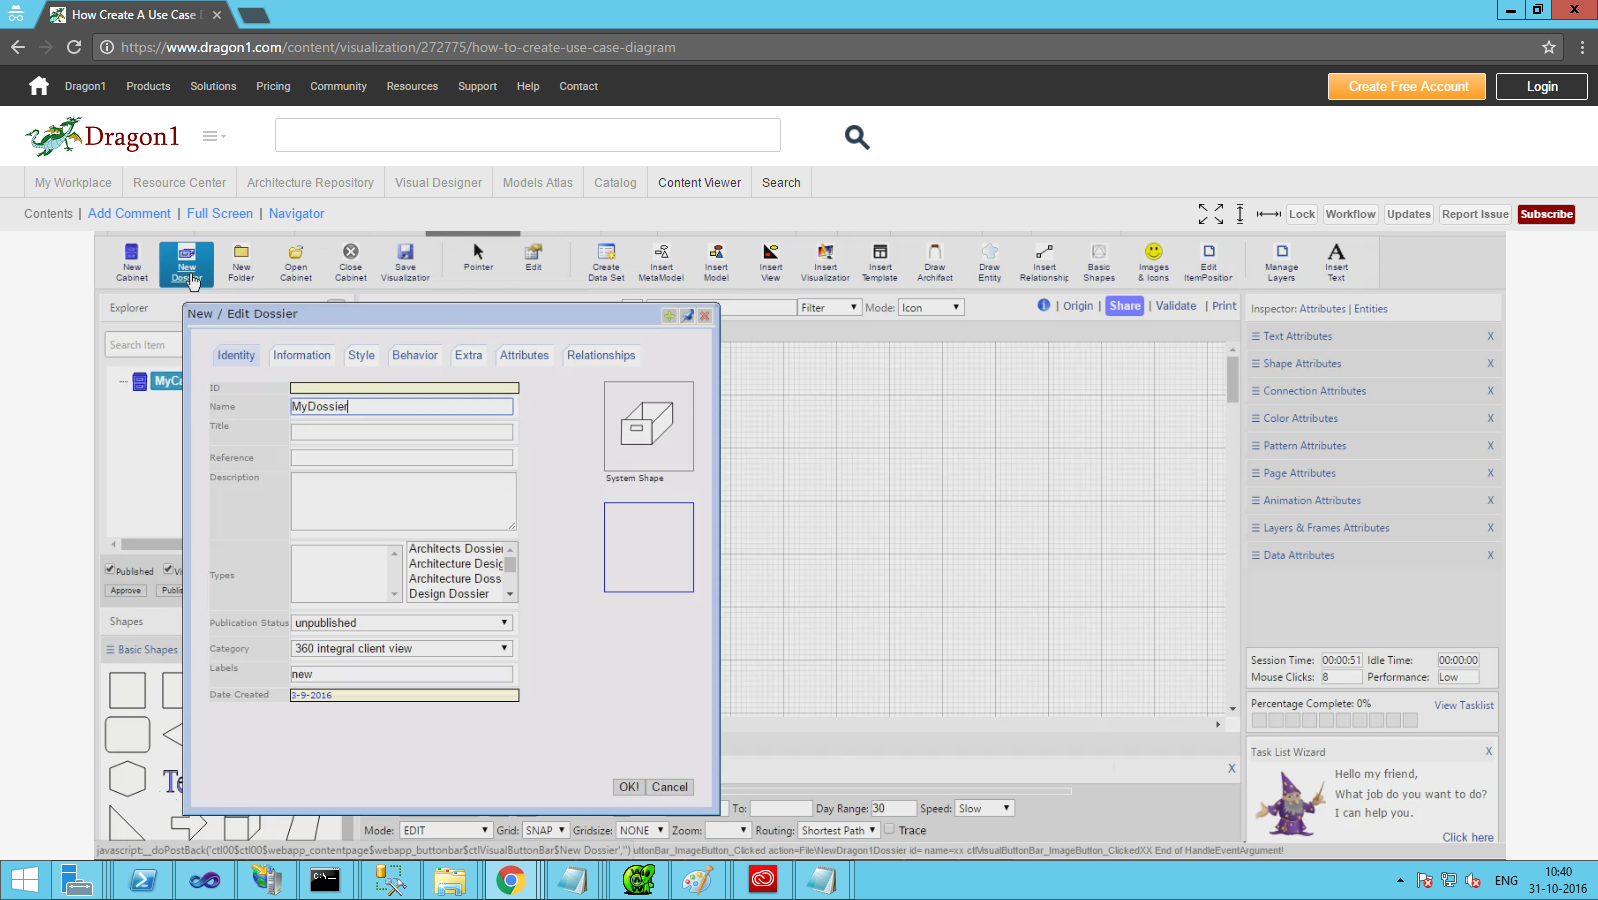
First, the users, like architects, create models, views, and visualizations. Next, they publish their products for viewing in the Viewer.
A product creator can publish it from 'hidden' to 'worldwide.' Check the page to see which states are available.
Learning Objectives
In this section, you will learn the following:
- What is the Viewer?
- How to add Comments
- How to filter a Visualization
- How to use the Workflow Window
- How to use the Updates and Changes Window
- How to send a message to someone
Click on a link to access a lesson.
Viewer for Interactive Content
The Viewer is exactly what the name says: a viewer for content. In the Visual Designer, visuals can be created, and this content can be watched in the Viewer. This can include static or dynamic views of models, as well as presentations (frames as slides) and videos in the background, accompanied by a visualization of a leader fading away.
The content can be watched on any device, like a PC, Laptop, Tablet, or Smartphone, anytime, anywhere. This provides stakeholders with a valuable opportunity to utilize the visuals in meetings, study the visualizations on the go, and support informed decision-making.
The visuals can be diagrams, documents, pictures, presentations, and videos, and can contain any content: information, communication, a lesson from courseware, a contract, or a research publication.
Add Comments
In the Viewer, you can add comments to a visual you are watching. You can add comments on the published visual by clicking the Add Comments button.
How to Filter a Visualization
Sometimes visualizations are full of data and information. If you do not need all that, you can filter a visualization.
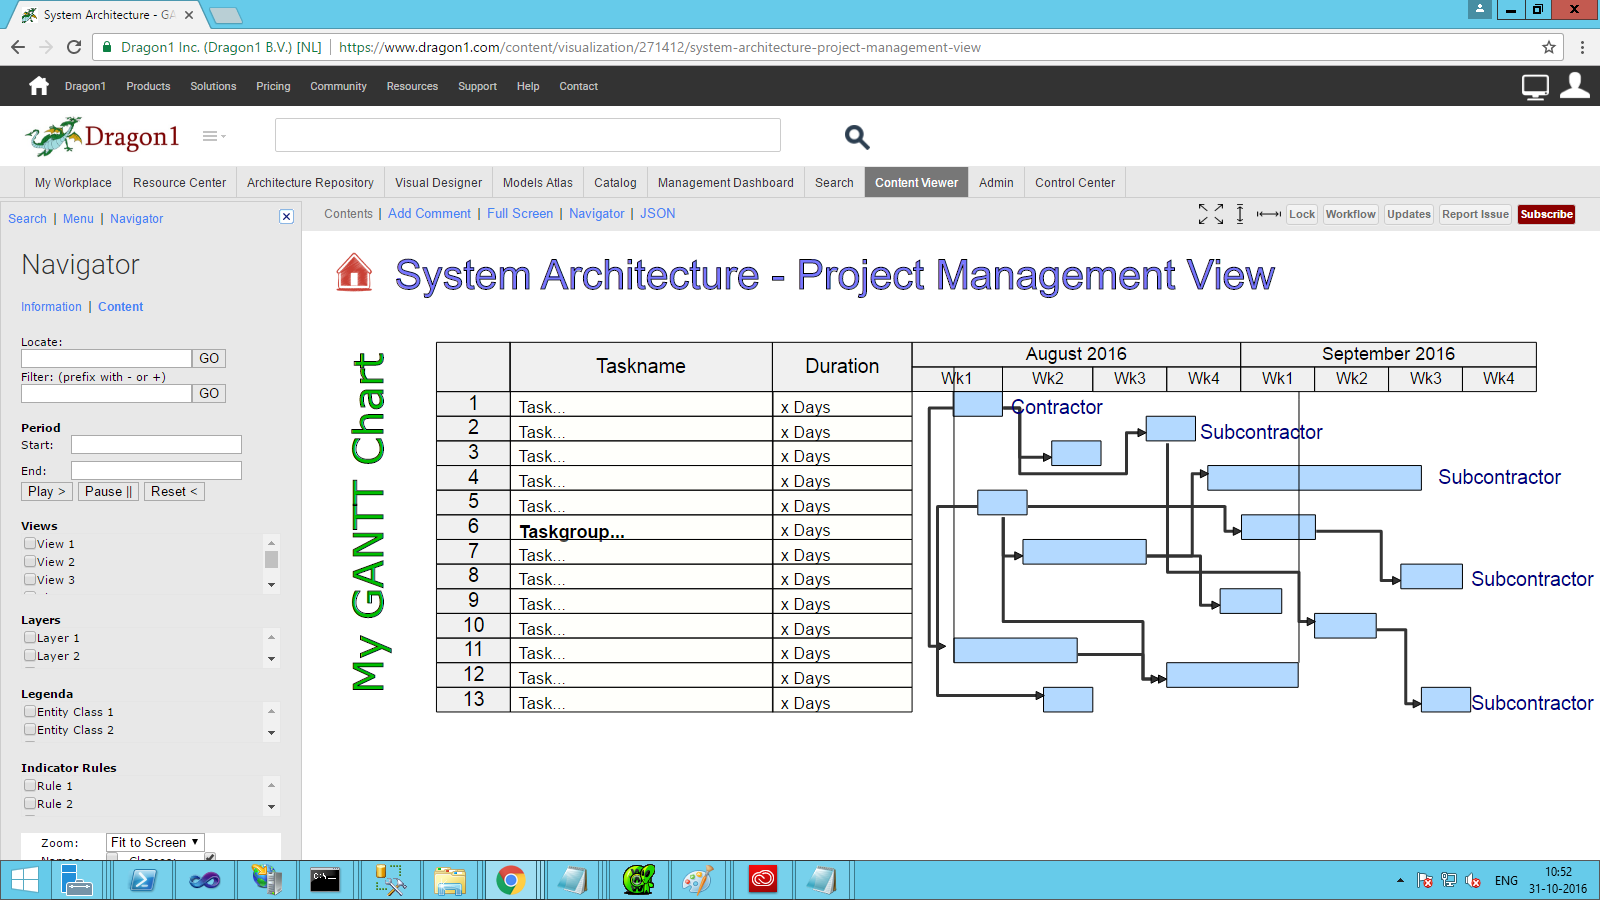
Select a visualization first, then click on Navigator. Next, the search window will open up on the left. You can filter or select data by typing the name in the Search panel.
In this panel, you switch layers, frames, and data classes on and off. Click on the right name or number to see how the visualization changes.
Published and Hidden visualizations
Whether or not certain visuals are visible in the Viewer depends on three things:
- If you are logged in or not.
- Whether you have certain privileges;
- What publication status is the creator given?
If the visual is published worldwide (only possible if the account has status OPEN), anyone can see the visual, even without being logged in.
If the creator has published the visual as private or privileged, you can only access the visual if logged into the same account as the creator and share the same role and organization. Every user in an account is assigned to a role and an organization (like a department, class, or project).
How to Pan a Visualization
To pan the visualization (drag it as a whole), hold down the CTRL key and drag the visualization.
How to Browse a Presentation
The visualization may consist of several frames (slides). In that case, the presentation could start because the autoplay is switched. Or you may have to walk through the slides manually. Just click on the forward and backward arrows in the Viewer.
Fullscreen
You may want to watch the visualization full screen, or you may want to present it. In that case, click on the full-screen button. The keyboard arrow keys and the mouse buttons can be used to walk through the slides.
Press the ESC key to end the full-screen mode.
How to Click Through
If the creator has created a click-through link, your cursor will change into a hand (pointer). If you click on the shape, you will be forwarded to whatever visualization is linked, or an external browser link will be started.
How to Get a Popup Dialog
You can only get a Popup Dialog Box if you go with a mouse over a shape and the creator fills in the description and an image for that shape.
To hide Popup Dialogs, select the option none in the Navigator panel.
Data Properties
If made available by the creator, you can watch the Data Properties of a selected shape or entity in the resizable Window below the Canvas Window. To enlarge the properties window, drag the bar.
Playing Scenarios
The creator can create a scenario, Next to visuals like presentations and videos. A scenario is a series of conditional changes applied to a model, view, or visualization. A scenario has a beginning situation and an end situation.
If the creator created a scenario, you can play the scenario in the Scenario Window below the Canvas Window. The Scenario Window is only available if a scenario model was published for this visual.
Using the Workflow
If the creator of the visualization has defined a workflow for the visualization, you can see it by clicking on the Workflow in the Viewer.
Messages
If you want to send a message to someone in the workflow, click on the blue message button.
Using the Data Changes and Models Updates Window
Every data change and model update is registered. To view the updates and changes made to a visual, click the 'Changes and Updates' button located at the top right of the window.
Search Visuals
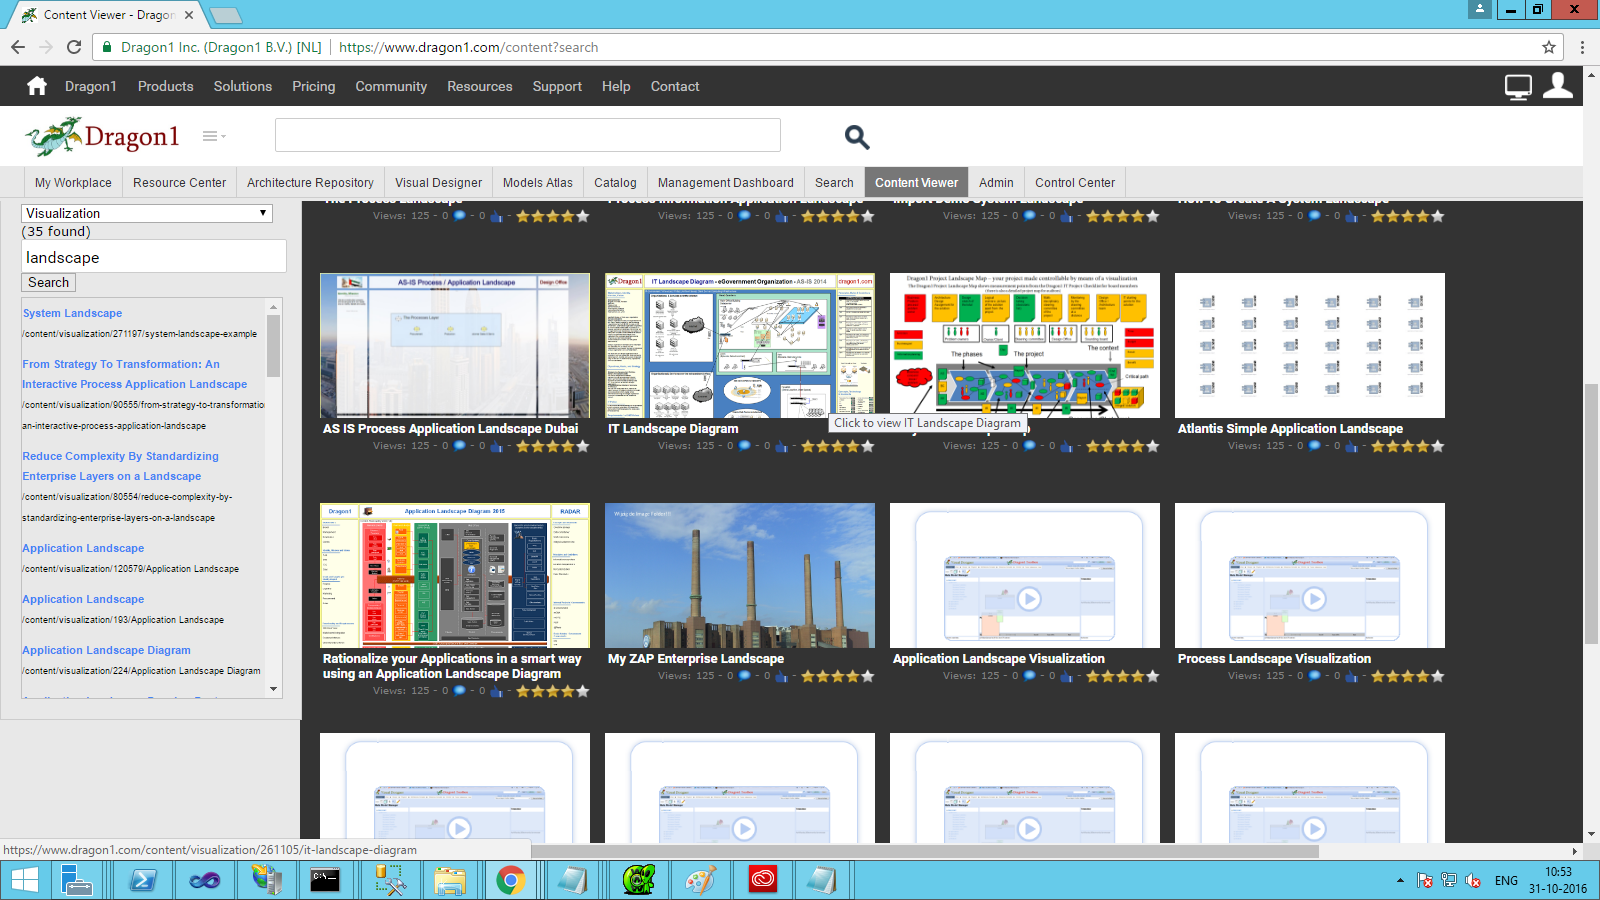
In your Viewer, many visuals may be published. If you click on 'Navigator' in the user interface, you can look up visuals by entering a name in the search field and clicking 'Search'.
Alter a Visual
Depending on what the visual creator has switched on, some shapes can be moved or deleted from the visual (on the client side only). In this way, you, as the Viewer, can adjust the visuals to your liking. You cannot save your version, but you can print it or save it as a PDF.
The creator may even have placed a button bar on the visual, enabling you to add shapes with rules and constraints applied to them. In this way, the creator can create a small User Defined Modeling Application.


