What is a Visualization?
Views for Stakeholders
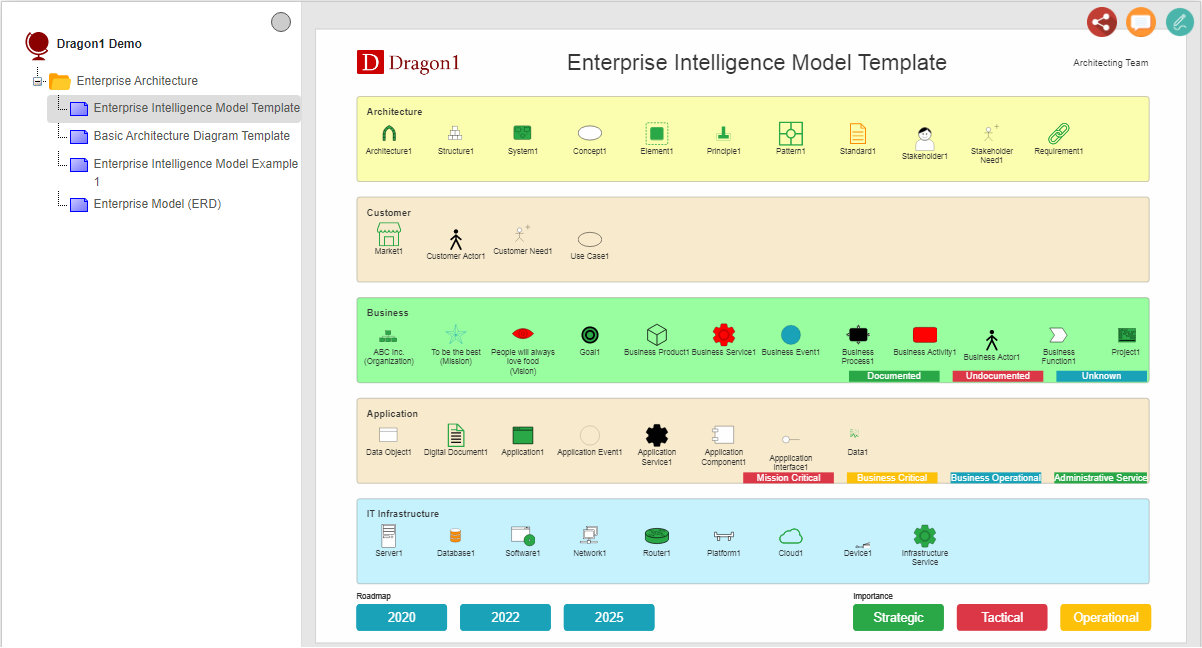
A visualization (architecture visualization) is a graphical representation of a model or view (a filter of a model). The same model or view can be visualized for various stakeholders in different ways that resonate better with the mindset of the viewers.
There are many types of architecture visualizations. The visualizations are mainly used to manage transformation in companies.
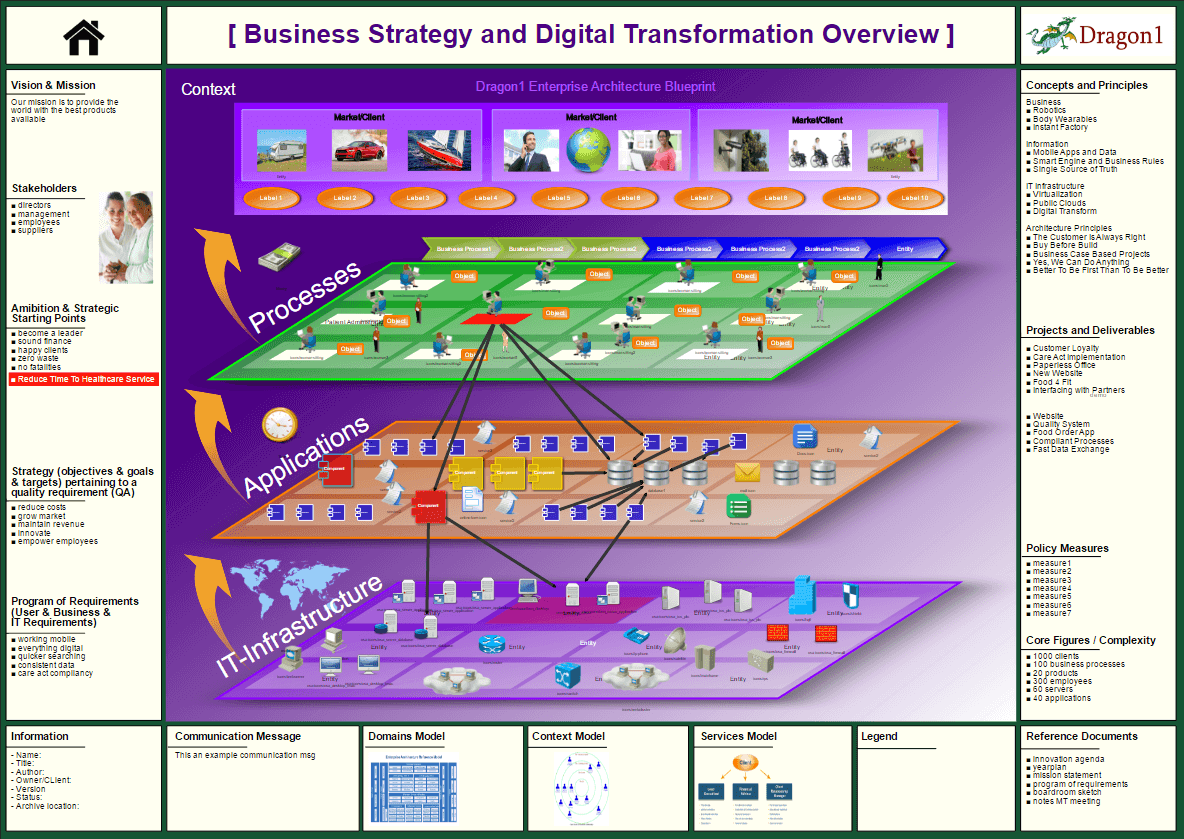
The visualization above has been generated using a visualization template. The template is populated with an enterprise model (a set of related enterprise data entities).
On this visualization, you see four layers. Layers are typical for architecture visualizations. Each layer is a different perspective or view of the company. And this visualization brings all these views together into a comprehensive view.
The top layer of the visualization is the market layer and shows the markets, target audiences, products, goods, and services this company provides.
The layer below is the business layer. It shows the company's business domains, functions, processes, and roles. Of course, you can visualize other items in a layer if that is more appropriate in your case.
In the applications layer, the company's information domains, services, applications, data objects, and interfaces are shown.
In the IT Infrastructure layer, you see the infra domains, services, servers, networks, clouds, routers, hubs, gateways, switches, and firewalls that together form the company's IT.
This visualization also gives you the insights that this or any company is a holistic whole. If you change one thing, it has an impact on many other things.
You see a few relationships in these visualizations. They show the dependencies processes have on applications and IT infrastructure components.
What is an Architecture Visualization?
Architecture is a set of concepts applied to a system or structure, where the concept principles (the working mechanisms of the concepts) explain how the concepts work and will benefit the system or structure.
Given the provided definitions of architecture and visualization, an architecture visualization is a visualization of the concepts, principles, standards, and technologies of aspects of a system, structure, or solution.
The visualization above is an architectural visualization in the sense that the concepts and principles are named at the right top of the visualization in the border. In the layer, you see the element (the functional parts of the concepts.
On the left border, you see the information that contains parts of the strategy. This strategy requires certain concepts, principles, and standards to be implemented in the company.
Dragon1 as a platform supports you in generating these kind of visualizations and creating these kind of visualizations.
The visualization above is a generated diagram and can be accessed here for live viewing.
On Dragon1, generating visualizations with any layers and column layout containing these shapes is easy. Here you can read more about how to generate visualizations
Interactive Visualizations
All the visualizations you create are generated in real-time from data from the .dragon1 File or the repository. This enables the visualizations to be interactive. This means that if you click on a shape, you get detailed information about the entity it represents. Also, it could be that if you click on a shape, you are forwarded to another visualization or related document. This all depends on how the creator of the visualization has created his visualization.
Types of Architecture Visualizations
Dragon1 defines the following main classes of architecture visualizations:
- Landscape
- Roadmap
- Blueprint
- Design Sketch
- Heatmap
- Details Diagram
- Overview Diagram
These types of visualizations can be used for the various common architectures in an organization, resulting in the following types:
- Enterprise Framework
- Enterprise Landscape
- Enterprise Roadmap
- Enterprise Blueprint
- Enterprise Design Sketch
- Enterprise Heatmap
- Enterprise Artist Impression
- Business Framework
- Business Landscape
- Business Roadmap
- Business Blueprint
- Business Design Sketch
- Business Heatmap
- Business Artist Impression
- Data Framework
- Data Landscape
- Data Roadmap
- Data Blueprint
- Data Design Sketch
- Data Heatmap
- Data Artist Impression
- Application Framework
- Application Landscape
- Application Roadmap
- Application Blueprint
- Application Design Sketch
- Application Heatmap
- Application Artist Impression
- Technology Framework
- Technology Landscape
- Technology Roadmap
- Technology Blueprint
- Technology Design Sketch
- Technology Heatmap
- Technology Artist Impression
- Security Framework
- Security Landscape
- Security Roadmap
- Security Blueprint
- Security Design Sketch
- Security Heatmap
- Security Artist Impression
- Solution Framework
- Solution Landscape
- Solution Roadmap
- Solution Blueprint
- Solution Design Sketch
- Solution Heatmap
- Solution Artist Impression
- Architecture Diagram
- Concept Design Sketch
- Principles Details Diagram
- Process Application Landscape
- Application Skills Landscape
- Concepts Overview Diagram
- Processes Overview diagram
- Applications Overview diagram
On this Dragon1 Help, you will find an example of most visualizations.
Generating an Architecture Visualization
Dragon1 supports you in generating any type of visualization. Click on the link to read more about it.
Creating an Architecture Visualization
Dragon1 supports you in creating any type of visualization. Click on the link to read more about it.
Managing with Architecture Visualizations
Dragon1 supports you in managing with architecture visualizations. Click on the link to read more about it.


