What is a Visualization Template?
A Predefined layout
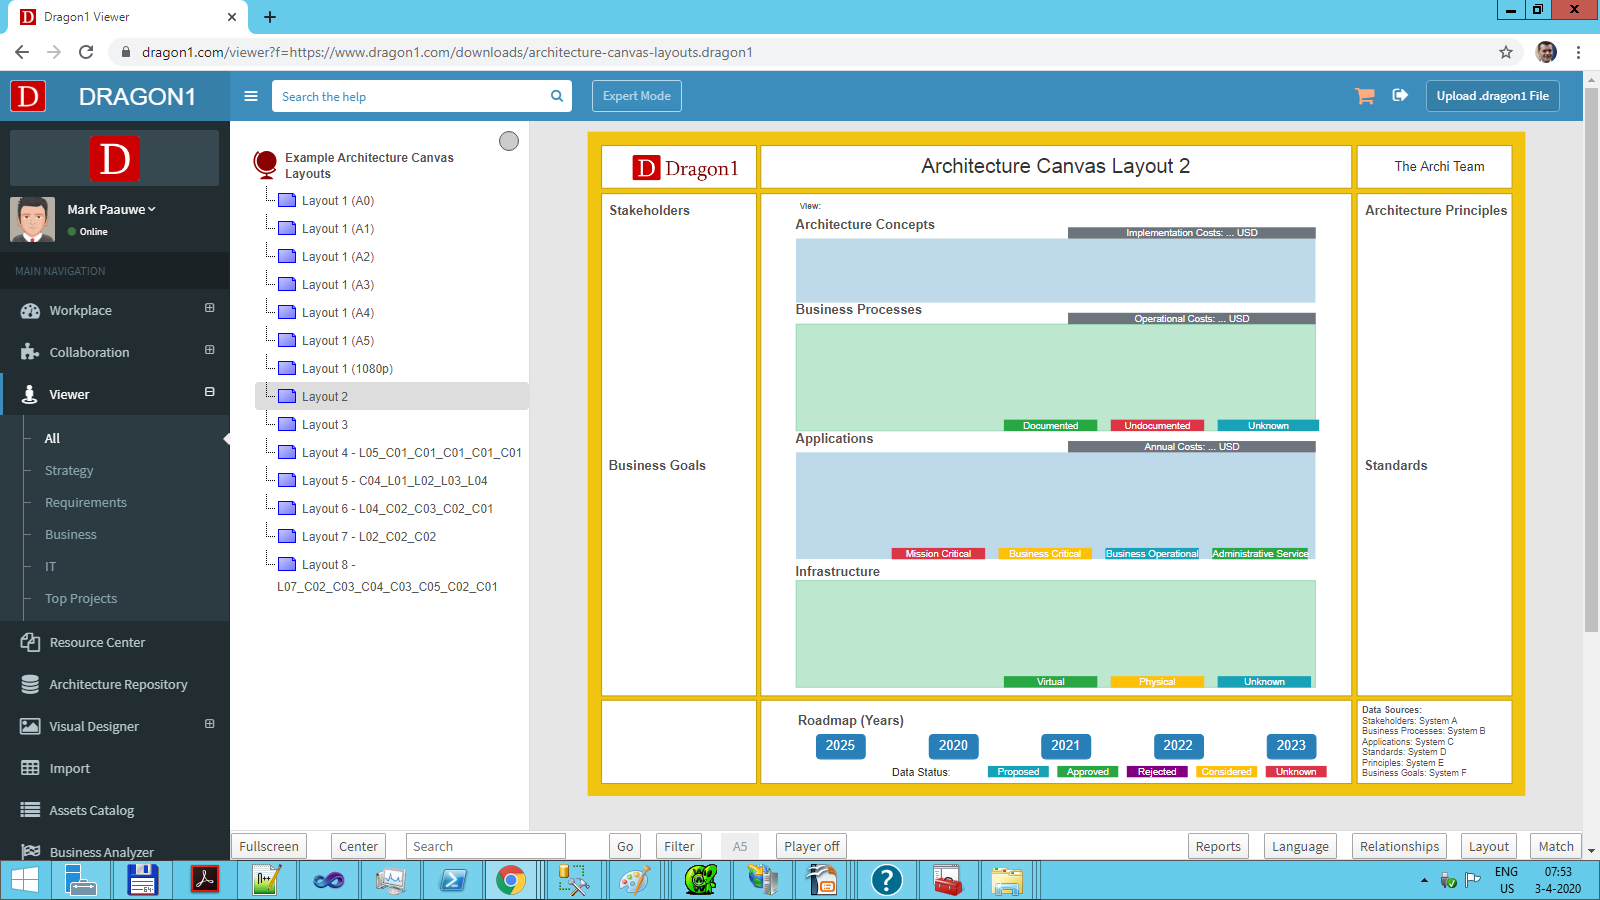
A visualization template is a set of areas forming a canvas with a predefined layout and an expected data set.
A visualization template consists of one or more areas. These areas are the placeholders for certain data types, shapes, and icons. These areas will be populated with shapes and icons based on available data and view rules.
Populating a Visualization Template with Data
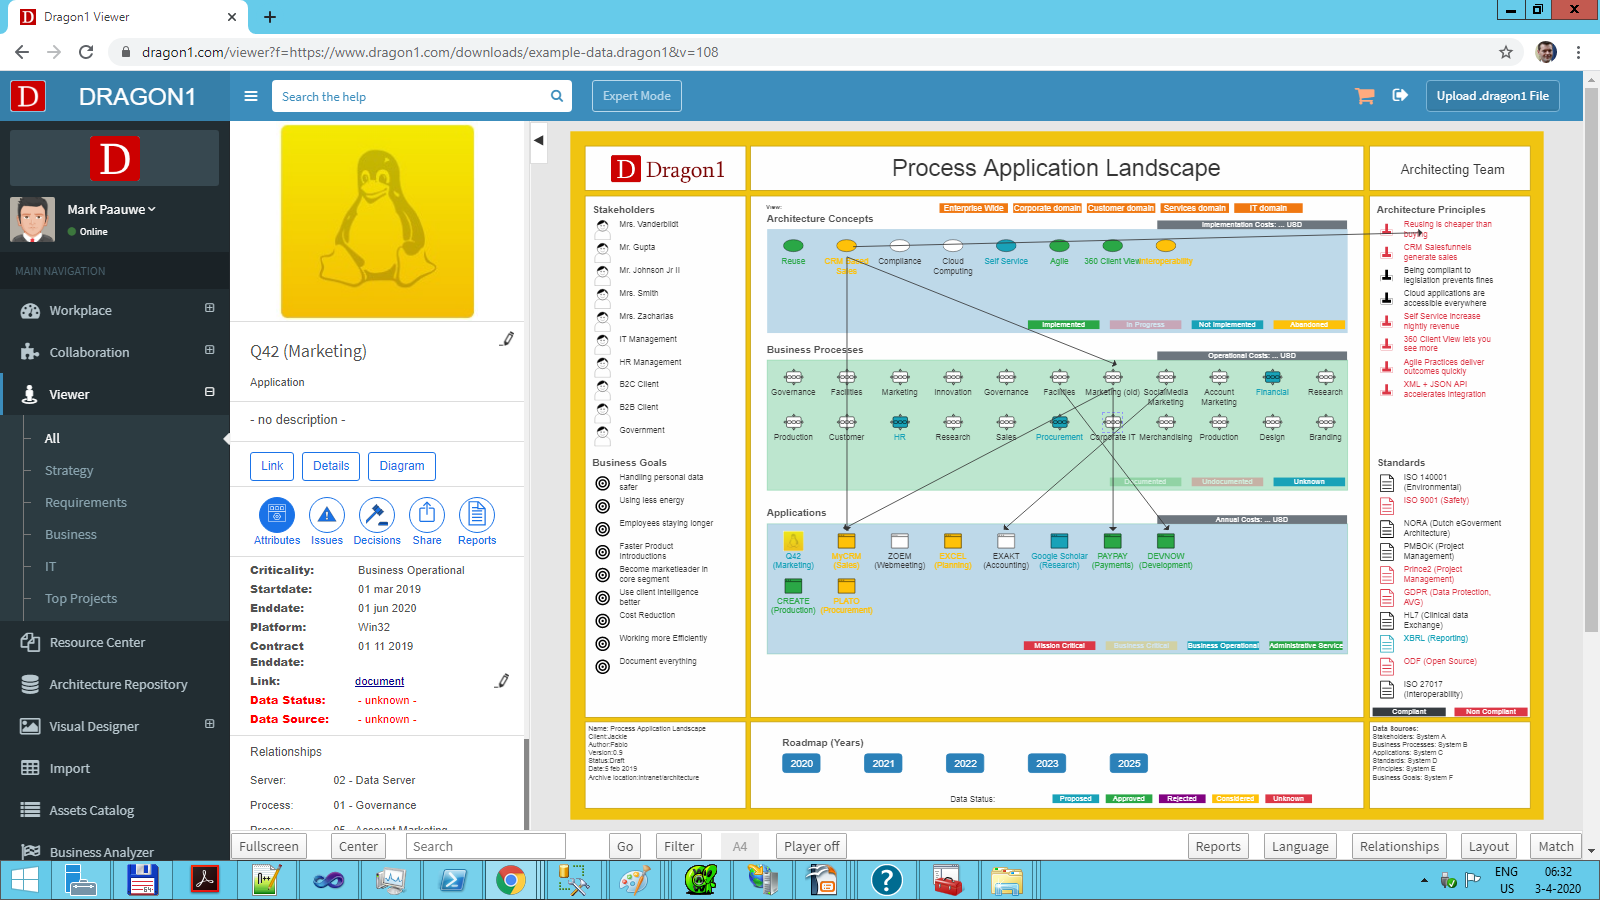
Above you see an example of an empty Process Application Landscape visualization template and below that a populated Visualization template with data from a user.
There are two ways a visualization template can be used: with data coming from .dragon1 Files and with data coming from the repository.
The benefit of a visualization template is that it improves the productivity of a Dragon1 user significantly. The user now only has to focus on collecting data and the quality of the data.
Dragon1 provides more and more visualization templates, which are also very configurable. So, once you know how they work, you might prefer them above creating your visualization from scratch.
If you want to see more templates or layouts, click on this architecture canvas layouts link.
Here you can learn more about the .dragon1 File.
Editing a Visualization Template
A visualization template often has many configurable items. Every available template has a page on the Help system with detailed options. For more information check the Working with Visual Items.
Available Visualization Templates
Currently, every month, new visualization templates are released.
The top ten most popular visualization templates are:
- Business Model Canvas
- Strategy Map
- Process Application Landscape
- Layered Enterprise Model
- Enterprise Architecture Blueprint (3D-ish)
- Stakeholder Onion Diagram
- Capability Gap Analysis
- IT Landscape
- Capability Heatmap
- Process Application Skills Landscape
Check the Templates and Tutorials section for available templates.
Visualization API
Although it is a simple URL API, it is still powerful.
You can call the Viewer application via a URL in a browser to generate a visualization based on a template.
If you build a URL like this and provide a valid .dragon1 File from your web server, you will see a visualization being generated.
You can generate a .dragon1 File (JSON structured) on your system and specify in the .dragon1 File which template should be used to view the data.
The same data can be viewed with a process application landscape or business model template.
If you want to generate several visualizations at once, you generate a .dragon1 File with the contents of an atlas, specifying several visualizations with each a different template, reusing the same data over and over again.
Using visualization templates, you can have real-time architecture data being unlocked to many people.
A popular use case for this security architecture is where you do not want to lose time creating diagrams. But want to start making the right decisions.


