Create a Customer Journey Map

Path of Experiences

A Customer Journey Map is a visualization of the path that a buyer or user walks in a shop, game, or application. It helps to communicate the story of the experiences your customer has with your brand across all your touchpoints.

Customer Journey Tutorial

On Dragon1, you can automatically generate a Customer Journey Map from scratch, using a visualization template or generating a map with an Excel sheet.

This page shows how to generate a Customer Journey Map with your own tailored data in two ways: 1) Using an Excel sheet and a visualization template and 2) entering the data in the Architecture Repository and using a visualization template.

Excel - It takes about 3 minutes to edit the data in the example Excel sheet and next to generate a Customer Journey Map with it and share it with your stakeholders.

Repository - It takes about 10 minutes to enter your data in the repository before you can generate and share the Customer Journey Map.

Example Customer Journey Map

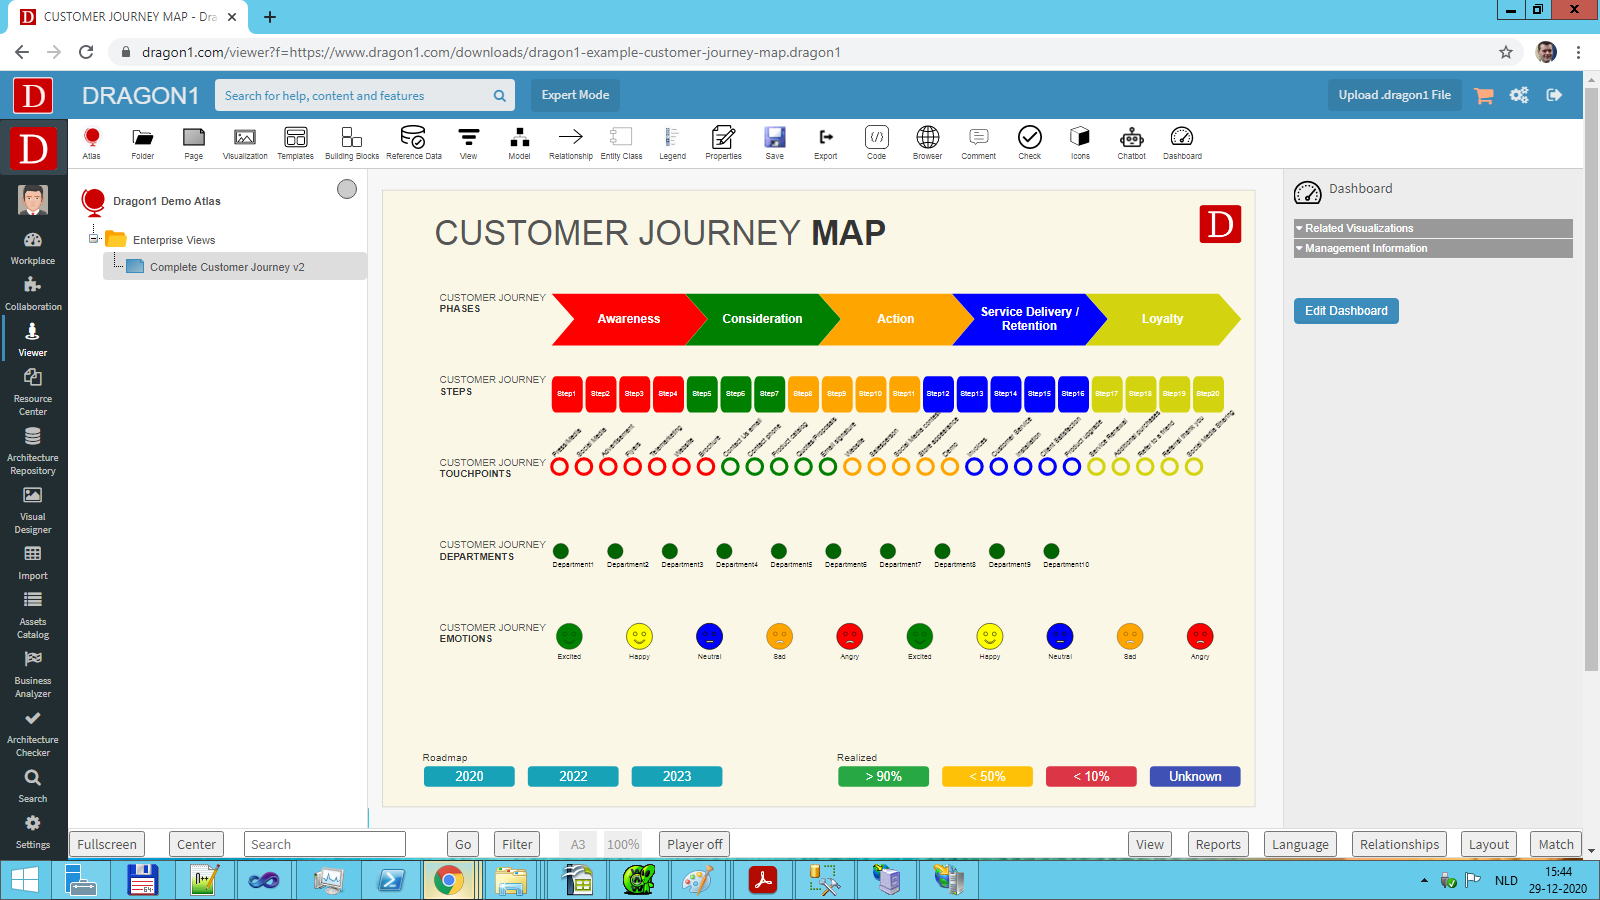
Below you see a screenshot of an example Customer Journey Map you can create on the Dragon1 platform.

dragon1 customer journey map

Created Customer Journey Map.

This visualization shows five layers:

  • Phases (or Stages)
  • Steps
  • TouchPoints
  • Departments
  • Moods (or Feelings)

Together this data makes up a model of the customer journey.

This is the data we will be entering first in the Architecture Repository. It could be we enter more data than we show, as we could decide we show an aggregated set of data.

How To Generate A Customer Journey Map using an Excel Sheet

To generate a Customer Journey Map using an Excel sheet and a visualization template:

  • Download the example Customer Journey Map excel sheet here.
  • Open the sheet in Excel or Open Office
  • Edit the data to your situation (fields marked with yellow color)
  • Click on Save
  • Go to the Import module.
  • Click on the Upload button and select your Excel Sheet file
  • Dragon1 has converted your Excel Sheet into a .dragon1 File (JSON structured)
  • Click on the Download .dragon1 File button
  • Go to the Viewer
  • Click on Upload .dragon1 File (the button at the right top)
  • Select your .dragon1 file
  • You see your generated Customer Journey Map.
  • Click on the Edit button at the bottom of your screen
  • Click on the Dashboard menu button to add your dashboard widgets
  • Also, you can add extra diagrams to your atlas that show details of the items on the Customer Journey Map.

How to Generate a Customer Journey by Entering Data in the Repository

  • Login
  • Go to the Data Dashboard
  • Add phases or stages in the data lists
  • Add steps or activities in the data lists (use Add Batch)
  • Add touchpoints (or devices) in the data lists (use Add Batch)
  • Add departments in the data lists (use Add Batch)
  • Add moods (or feelings) in the data lists (use Add Batch)
  • Create a Model (use, for instance, the name Customer Journey Model)
  • Create relationships between the data you entered
  • Create a Visualization
  • Provide a name for the Visualization
  • Set the Template to Customer_Journey_Map
  • Upload a picture as a bitmap for the Viewer
  • Set the visualization to published.
  • Set the model to the model you have created
  • Save the model
  • Watch it in the viewer
  • Click on the Share button to share it with stakeholders

How to draw a Customer Journey Map

You can make use of the Visual Designer if you don't like the basic template or want a bit different Customer Journey Map.

You can use the Visual Designer to create a model and draw the relationships. The relationships are automatically stored.

The Customer Journey Map template is a combination of a balanced scorecard and a Customer Journey Map.

To draw a Customer Journey Map in the Visual Designer

  • Go to the Visual Designer
  • Open cabinet
  • Create or Select visualization in a folder (make sure you double-click on the item in the tree view).
  • Use File New to select a template in the Visual Designer

Configuration option

The Customer Journey Map currently has no configuration options.

This tutorial will introduce how to create a basic Customer Journey Map with a dynamic view.

You will create this diagram by using the Dragon1 web applications Architecture Repository, Visual Designer, Viewer, and Resource Center.

You will take the following steps:

  • Create a Dossier structure [in the Architecture Repository]
  • Enter Data [in the Architecture Repository]
  • Create Relationships and a Model [in the Architecture Repository]
  • Create a View [in the Visual Designer]
  • Create a Visualization [in the Visual Designer]
  • Publish and Comment a Visualization [in the Viewer]
  • Embed a Visualization [in the Resource Center]