Create a Strategy Map

About the Strategy Map with Balanced Scorecard

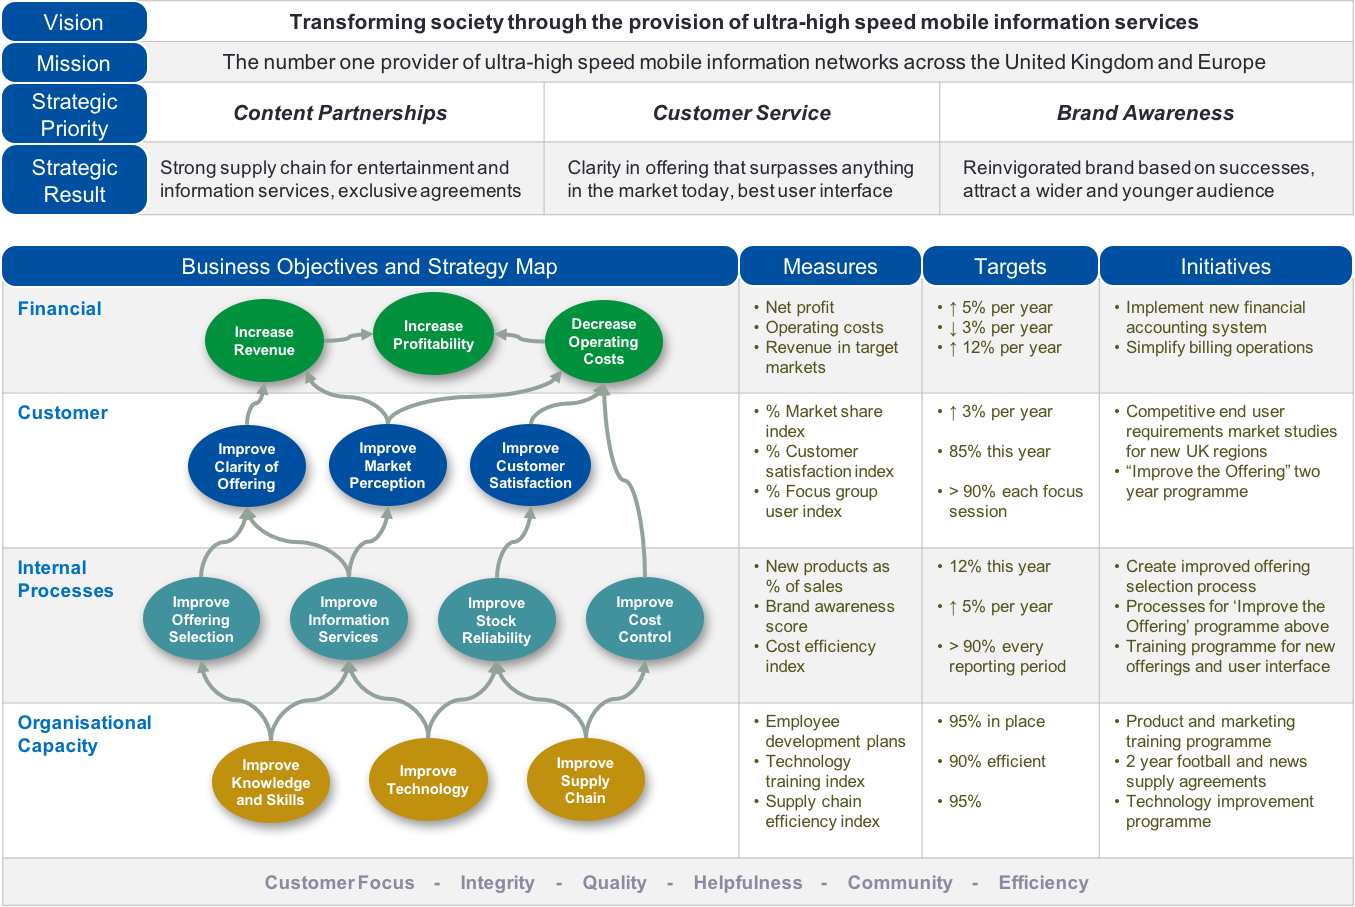
A Strategy Map with Balanced Scorecard (BSC) is a framework for implementing and managing enterprise strategy.

The strategic diagram links identity, mission, and vision to strategic objectives, measures, targets, and initiatives.

The diagram balances financial and performance measures with objectives from all parts of the organization. It is a tool to improve enterprise performance.

The strategies can also be determined for the enterprise architecture as well as for the business architecture and its business structure and domains.

Tutorial

On Dragon1, you can automatically generate a strategy map with BSC from scratch, using a visualization template or generating a strategy map with an Excel sheet.

This page shows how to generate a strategy map with your tailored data in two ways: 1) Using an Excel sheet and a visualization template and 2) entering the data in the Dragon1 repository and using a visualization template.

Excel - It takes about 3 minutes to edit the data in the example Excel sheet and next to generate a strategy map with it and share it with your stakeholders.

Repository - It takes about 10 minutes to enter your data in the Repository before you can generate and share the strategy map.

Example

Below is a screenshot of a Strategy Map example with a Balanced Scorecard you can create on the Dragon1 platform.

dragon1 strategy map tutorial

How to Create a Strategy Map.

Dragon1 Viewer

Excel Sheet

Data Manager


This visualization shows three parts:

  • Strategic Direction
  • Objectives Hierarchy
  • Measurables

Together, this data makes up a model of the strategy.

This is the data we will first enter in the architecture repository. It could be we enter more data than we show, as we could decide to show an aggregated data set.

How To Generate A Strategy Map Using an Excel Sheet

To generate a strategy map using an Excel sheet and a visualization template:

  • Download the example Strategy Map excel sheet here.
  • Open the sheet in Excel or Open Office
  • Edit the data to your situation (fields marked with yellow color)
  • Click on Save
  • Go to the Import module.
  • Click on the Upload button and select your Excel Sheet file
  • Dragon1 has converted your Excel Sheet into a .dragon1 File (JSON structured)
  • Click on the Download .dragon1 File button
  • Go to the Viewer
  • Click on Upload .dragon1 File (the button at the right top)
  • Select your .dragon1 file
  • You see your generated strategy map with a balanced scorecard.
  • Next, you can add extra diagrams to your atlas that show details of the items on the strategy map
  • Read on the Help pages how to do that.

How To Generate A Strategy Map by Entering Data in the Repository

  • Login
  • Go to the Data Dashboard
  • Add an identity, vision, and mission in the data lists
  • Add objectives in the data lists (use Add Batch)
  • Add metrics in the data lists (use Add Batch)
  • Add targets in the data lists (use Add Batch)
  • Add initiatives in the data lists (use Add Batch)
  • Create a Model (use, for instance, the name Strategy Model)
  • Create relationships between the data you entered
  • Create a Visualization
  • Provide a name for the Visualization
  • Set the Template to Strategy_Map
  • Upload a picture as a bitmap for the Viewer
  • Set the visualization to published.
  • Set the model to the model you have created
  • Save the
  • Watch it in the Viewer
  • Click on the Share button to share it with stakeholders

How To Draw

You can use the Visual Designer if you don't like the basic template or want a slightly different strategy map.

You can use the Visual Designer to create a model and draw the relationships. The relationship is automatically stored.

The strategy map template combines a balanced scorecard and a strategy map.

To draw a strategy map in the Visual Designer:

  • Go to the Visual Designer
  • Open cabinet
  • Create or Select visualization in a folder (make sure you double-click on the item in the tree view)
  • Use File New to select a template in the Visual Designer

Configuration Option

The strategy map currently has no configuration options.

This tutorial will introduce how to create a basic Strategy Map with a dynamic view.

You will create this diagram by using the Dragon1 web applications Architecture Repository, Visual Designer, Viewer, and Resource Center.

You will take the following steps:

  • Create a Dossier structure [in the Architecture Repository]
  • Enter Data [in the Architecture Repository]
  • Create Relationships and a Model [in the Architecture Repository]
  • Create a View [in the Visual Designer]
  • Create a Visualization [in the Visual Designer]
  • Publish and Comment a Visualization [in the Viewer]
  • Embed a Visualization [in the Resource Center]

Step 1. - Create a Dossier Structure

First, we will create a dossier structure to store our data in a cabinet.

To create a dossier structure:

  • Go to the Architecture Repository
  • Create or open a Cabinet
  • Select the cabinet in the Explorer treeview
  • Create a dossier
  • Create four folders in the dossier: Data, Model, Relationships, View, and Visualization.
  • Create subfolders in the Data folder: Mission, Vision, Identity, Objectives, Goals, Initiatives.
dragon1 data strategy map in visual designer

Enter Data for Strategy Map in Visual Designer.

Step 2. - Enter data in the folders

To enter data:

  • Select a folder
  • Click on Insert Entity
  • Select the type of data you want to enter
  • Type at minimum a name for the data.
  • Click OK and see that the data is entered.

Enter the following type of data in the folders:

  • 1 Identity
  • 1 Mission
  • 3 Strategic Priorities
  • 3 Strategic Results
  • 3 to 10 Financial Objectives
  • 3 to 10 Customer Objectives
  • 3 to 10 Internal Processes Objectives
  • 3 to 10 Organizational Capacity Objectives
  • Financial Measures, Target and Initiatives
  • Customer Measures, Target and Initiatives
  • Internal Processes Measures, Target and Initiatives
  • Organizational Capacity Measures, Target and Initiatives
  • 5 to 7 Values

Step 3. - Create a Model

To create a model:

  • Go to the Visual Designer
  • Create or open a Cabinet
  • Select a folder
  • Insert a model from the menu bar
  • Enter a name for the model
  • Optionally choose a type for the model
  • Insert shapes like processes and applications for the model by clicking on Draw Archifact or Draw entity and drag shapes onto the canvas
  • You can change the color and size of the shapes.
  • Draw connections between the shapes using the smart tools of a selected shape.

Step 4. - Create a View

To create a view:

  • Go to the Visual Designer
  • Create or open a Cabinet
  • Select a folder
  • Insert a view from the menubar
  • Enter a name
  • Select the model to use
  • Enter a viewing rule for the model data:
    • Rule Event: onload
    • Rule Condition: Class=Process; Name=Sales; Relation=FirstLevel
    • Rule Action: Show(name)

Step 5. - Create a Visualization

To create a visualization:

  • Go to the Visual Designer
  • Create or open a Cabinet
  • Select a folder
  • Insert a visualization from the menubar
  • Drag a shape on the canvas. You will use this shape to generate the view data on the canvas.
  • Save the visualization
  • Select the view shape
  • Enter the following view rule in the data attributes panel of the inspector.
    • Rule Event: onload
    • Rule Condition: Class=Process
    • Rule Action: Show(name)

With this rule, you will only see the processes from the view data. You can also show the whole view with Rule Condition = *.

Enterprise Realization

For more reading is here a page about Strategy Realization