How to do an Architecture Project
On the Dragon1 platform, you can do many things. However, before that, you may want to take the first steps to set up a basic architecture project that includes all the essential components.
After doing the steps on this page, you are familiar with a couple of features in the four core web applications: Resource Center, Architecture Repository, Visual Designer, and the Viewer.
This will give you a sound foundation to find your way around Dragon 1 for further exploration.
Projects List Example
First Project
Your first project will be to set up a project to standardize the application landscape of an organization working with enterprise architecture.
Every organization has business processes and software applications. It is common these days to share a lot of data between processes.
So, what you want to prevent is that you store the same data in every process in different databases. You want to reuse things.
By creating a process-application landscape, you can see what data (or information objects) is shared and not shared between processes and what you can improve.
You also see what type of data (like personal or sensitive data) is handled by which processes and applications and is stored in what databases.
With these overviews, you can create a design or a plan on what applications to deduplicate and what interfaces to standardize so that the organization benefits more from better-exchanged data.
But you still need to ensure that the architecture documents you create are used by the project executing the change.
On the Dragon1 platform, you will set up an architecture project with visual products that anyone in the project can use.
Step 1. - Creating a Project
First you create a project
To create a project:
- Go to the Collaboration menu item at the left and expand it
- Click on the Projects menu item at the left
- You see a list of demo projects on your screen, or you have an empty screen (Note that you can hide the demo data via your settings)
- Click on Add a project in the projects list
- Fill in your project details and click on save
- After doing this, your project is added to the list and added as an entity in the repository.
Step 2. - Add Activities to the Project
A project consists of activities you do together with others.
To add activities to the project:
- Click on a project on the list
Step 3. - Add Documents to the Project
In the activities, you will use input documents, and the activities will produce new documents.
To add documents to the project:
- Click on a project on the list
- Click Add Document
- Fill in the details
Step 4. - Create Content Pages In the Resource Center
On Dragon1, you often create the following seven resource center pages for projects:
- Business Strategy
- Business Model
- Business Case
- Program of Requirements
- Process Landscape
- Application Landscape
- Solution Architecture Model
- Solution Design
- Architecture Principles, Patterns, and Standards (Interfacing)
- Project Plan
- Roadmap
To create a content page on the Resource Center:
- Go to the Resource Center
- Click on Add First Page or on the menu on the right
- Enter a name for the page
- Enter content for the page
- Note that later on, you will be publishing models, views, and visualizations you created with the other web applications
As the project executes standardizing the application landscape, you can use the insights and overviews to monitor and ensure progress as an architect and the stakeholders in and around the project.
Step 5. - Create a Visualization
You create a clickable visualization that will be published in the Viewer to act as a starting page for your communication.
To create a visualization:
- Go to the Visual Designer
- Open your Tutorials cabinet
- Select a folder
- Insert a visualization
- Insert the start page template or create it yourself:
- Insert a background picture
- Insert 4 to 8 rectangles
- Make the transparent
- Create clickable links to the Resource Center pages from the rectangles.
Step 6. - Publish a Visualization
You can not only create architecture models on Dragon1, but you can also use the platform to communicate them to stakeholders. Stakeholders can also comment on the visual products you publish.
To publish a visualization:
- Go to the Visual Designer
- Select
- ...
Step 7. - Co-creating the Architecture Products
We end this page by pointing you towards the other help pages where you are guided to start co-creating the products you defined in the Resource Center.
Architecture Project Example
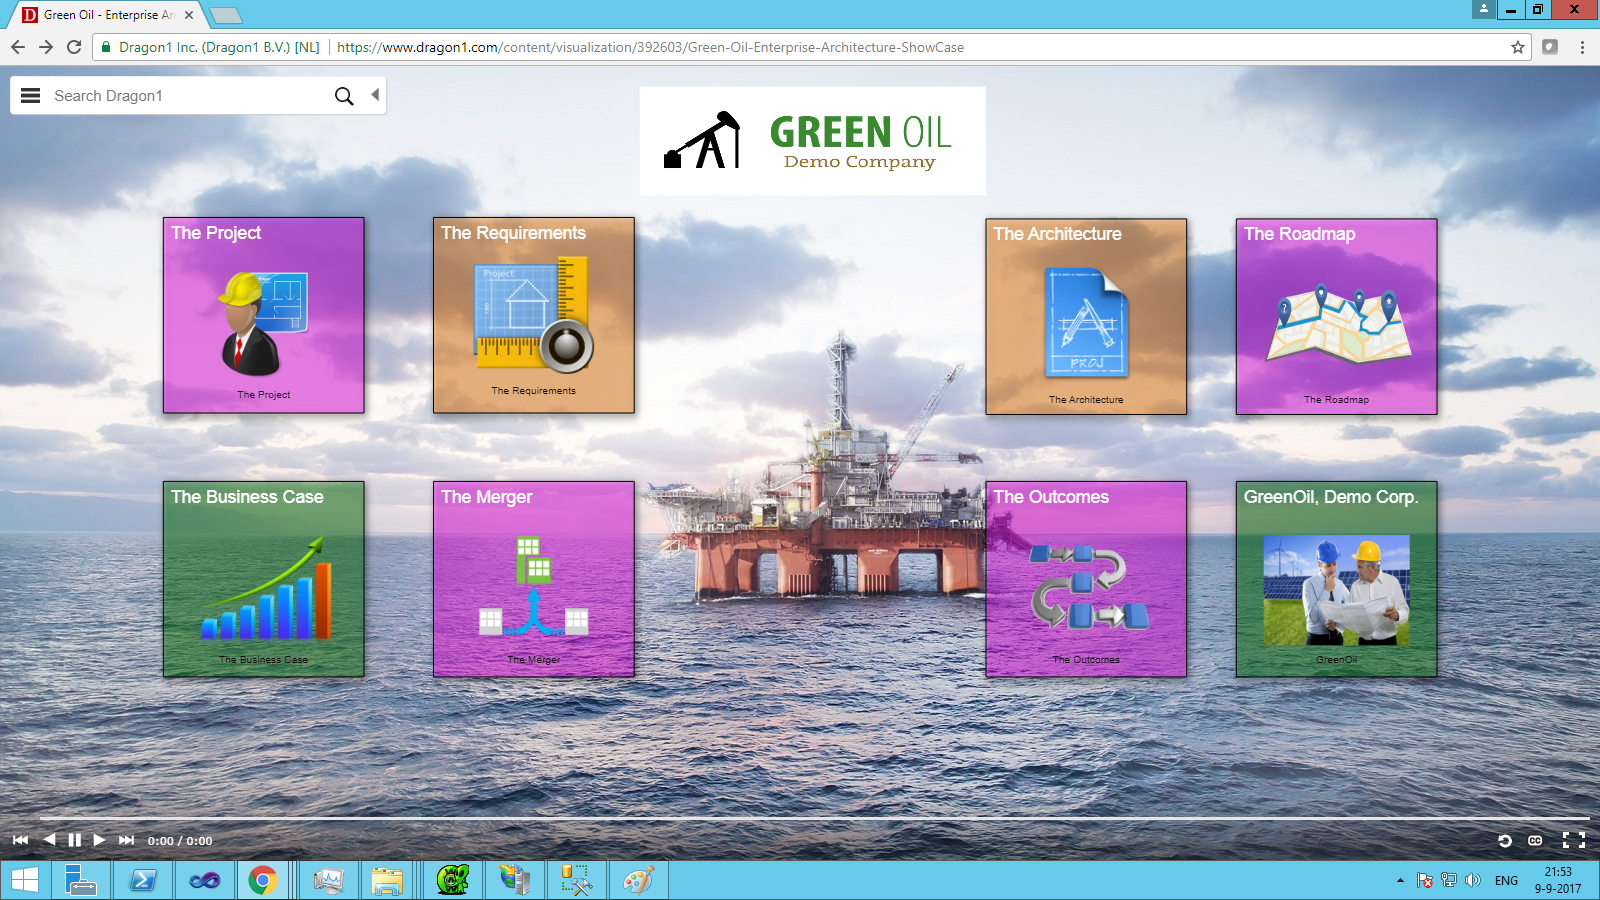
Below is an example screenshot of a project that works with architecture that could result from this page.


