Dragon1 makes data visualization available for Business, IT, Information, Security, Cloud, Solution Architects, Analysts, Managers, and C-level. You will get more out of your architecture data: creating and managing effective enterprise visualizations to guide business change.
Try Dragon1 PRO for Free
Data Visualization Tools Features in live demos
Big Data Visualization and Data Analytics
As an innovative saas solution, Dragon1 provides the Viewer. This enables you to visualize data, perform big data analytics, manage data, and secure data in realtime.
Visualization of Data and Analysis for Managing Operations.
Visualizing with Business Capabilities Benefits
Dragon1 Data Visualization Tools offer a wide range of benefits:
- Intuitive Interface: The user-friendly interface makes it easy for technical and non-technical users to create meaningful visualizations.
- Advanced Charting Options: Choose from a variety of customizable charts, graphs, and diagrams for the representation and visualizations effectively.
- Real-Time Data Integration: Connect to multiple data sources and visualize your data in real-time for up-to-the-minute insights.
- Interactive Dashboards: Create interactive dashboards that allow users to explore and interact with data, uncovering hidden patterns and trends.
- Collaboration and Sharing: Collaborate with team members and stakeholders by sharing visualizations, annotations, and insights.
- Scalability and Performance: Dragon1 handles large volumes of data efficiently, ensuring smooth performance even with complex visualizations.
- Data Security: Your data is protected with robust security measures, ensuring confidentiality and compliance.
- Mobile Accessibility: Access your visualizations on-the-go with Dragon1's mobile-responsive design.

Analyzing and Visualizing Data Visualizations in the Viewer.
Data Visualization Tools Basic and Unique Features
The Dragon1 Software consists of several integrated applications.
These are the Digital Workplace, Data Manager, Architecture Repository, Viewer, Data Dashboard, Visual Designer, ePortfolio, Search, Resource Center, and Application Manager.
Together, these web applications support you in making any Landscape, Roadmap, Blueprint, Scenario, Flowchart, Diagram, or Document you would like to make.
1. Task-Based Digital Workplace
The Tools for Visualizing Data enable you to do your office work online, like working task-based, document creation, and email to your coworkers. You get your digital workplace in the data visualization software tool with access to 1) specialized applications like the Architecture Repository and Visual Designer, 2) lots of example data and templates, and 3) online training and support services.
Data Visualization Tools for Managing Digital Transformation Roadmap examples.
Your Digital Workplace lets you be very productive because you can use a lot of checklists and task lists alone or in a team to produce valuable architecture products.
Read more about the Digital Workplace here.
2. Collaborative Diagram and Map Creation
The visualization tools provide specialized applications like the Viewer, enabling you to create any product, diagram, map, document, or matrix defined by common and open standards in the fields. You can do, for instance, requirements engineering in this Data Visualization Tool.
Co-creating of products in collaboration with teams! In real-time, you see what your colleagues have added or changed to the products. You can immediately give feedback on the work in progress. But first, via smart versioning, you and your team can model and visualize many different versions of the product to try out, so you use Dragon 1 as an Enterprise Architecture Transformation and Innovation platform that provides you the ability to create static and dynamic architecture products for managing information much easier.
A. Create A Dynamic Information Data System for Managers
GDPR Data Compliance Tool.
I. Enterprise Architecture Visualization (VEA) - Today organizations make use of Data Visualization Tools to visualize and comply with open standards, ISO and IEEE, the AS-IS situation and the TO-BE situation of the enterprise, the business model, IT infrastructure, and information systems. The users create visualizations of process landscapes and application landscapes or sometimes visualize an enterprise blueprint. These architectural designs and enterprise visualizations show the strategy and the business changes that support managing and controlling risks and saving time and costs.
II. Draw, Model, Visualize, and Generate - The tools for visualizing data allow you to draw and generate static and dynamic report views (diagrams and maps) compliant with open standards using the standard extensions.
You can make templated visualizations on top of views and models. If the data in the model or view changes, the enterprise data visualization is automatically updated with it.
III. Work with Templates and Checklists - Dragon 1 allows users to work with checklists and templates for diagrams, maps, and documents. You can reuse or edit the checklists and templates or make your checklist or template. This will raise your productivity tremendously.
B. Create A Static Enterprise Performance Model & Diagram
Business IT Services Technology Roadmap.
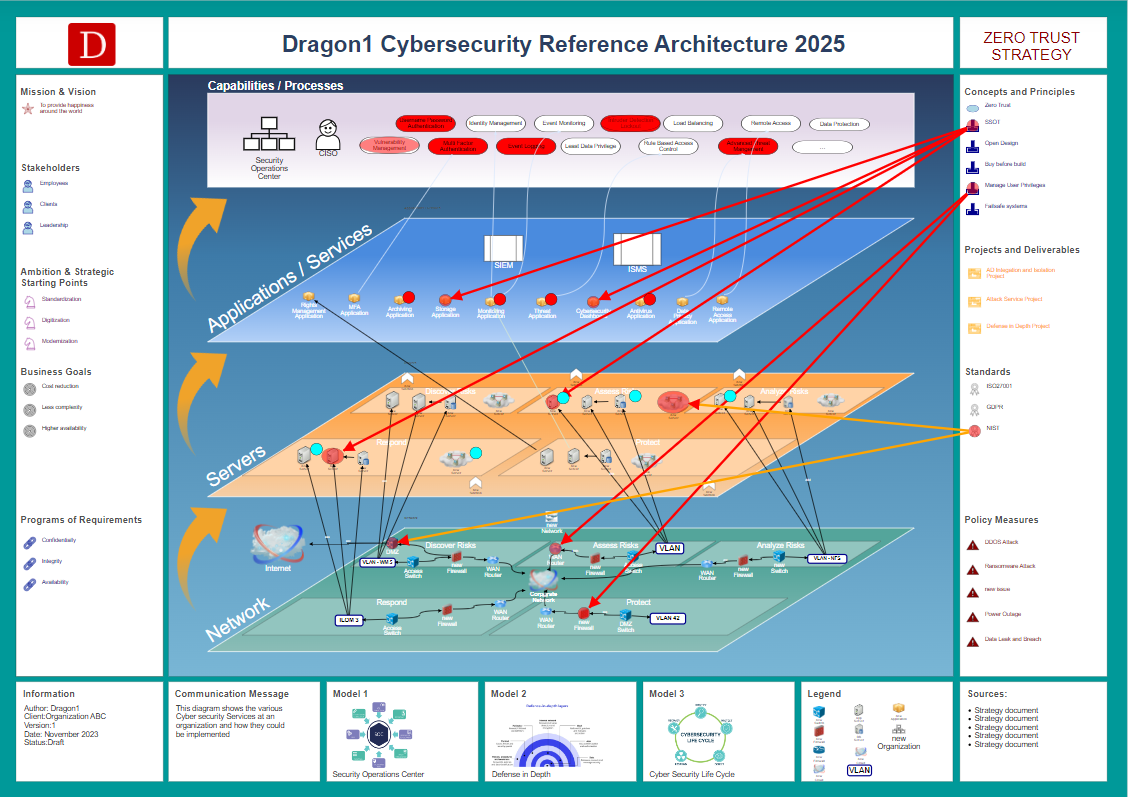
I. Indicators - You can create interactive diagrams and maps with indicators if static diagrams are not sufficient. As a user, you can add indicators to the interactive diagrams. Also, mouse over popups, with or without sound and image (YouTube videos), and clickable links to the background (policy) information.
II. Management Information - Use your enterprise visualization as a visual management instrument. The indicators and popup dialogs change in realtime, reflecting the changes in the data model. If, for example, applications and processes are not being executed in compliance with the policy, they can be colored red in a visualization. You will get a popup dialog information, via mouse over, on why they are colored red.
Let your company thrive in the digital age
We hope that you enjoyed reading this page and choosing Dragon 1 as your Data Visualization Tool.
With Smart Enterprise Data Visualization tools, you as a user can make high-level business, information, applications, technology maps, and much more smartly.
Evaluate this tool to create data visualizations and experience the benefits of Dragon1 Software for your customers. Do you know that you can use the platform as a Solution for Cyber Security or Digital Transformation? Purchase your Dragon1 PRO user license online in the Store.