About Application Landscaping
Using templated shapes to generate diagrams increases your productivity, and using color and icons increases the effectiveness of diagrams. So read on if you want to hear more about that.
Every organization has software applications, applications in short. All of these applications support the business processes in processing and storing information. However, applications also cost money, get out of date, and may have trouble interfacing with each other (for instance, because of different types of application platforms and technology).
Because applications age and get old, it is important to manage the applications by keeping an overview. Doing that only makes sense if you create an overview that gives valuable information on which you can decide which applications you have to replace, remove, or new ones to introduce.
Working with Templated Application Symbols
As you probably already know, Dragon1 Innovation Lab can be used as an online EA tool to create Application Landscapes. But what you might not know is that in the Visual Designer of Dragon1 Innovation Lab, you can create and work with Templated Application Symbols.
Here, you see a screenshot of the Visual Designer with an instance of the default templated shape for 'Application' selected. A Dragon1 Templated Shape is a shape that consists of visual elements that can change the size, color, and visibility based on attribute value or other filters.
For an organization, human, product, service, process, application, database, client, server, and network default templated shapes are available.
Dragon1 makes use of SVG, the Scalable Vectors Graphics standard, so that you can create and use predefined and newly defined shapes easily.
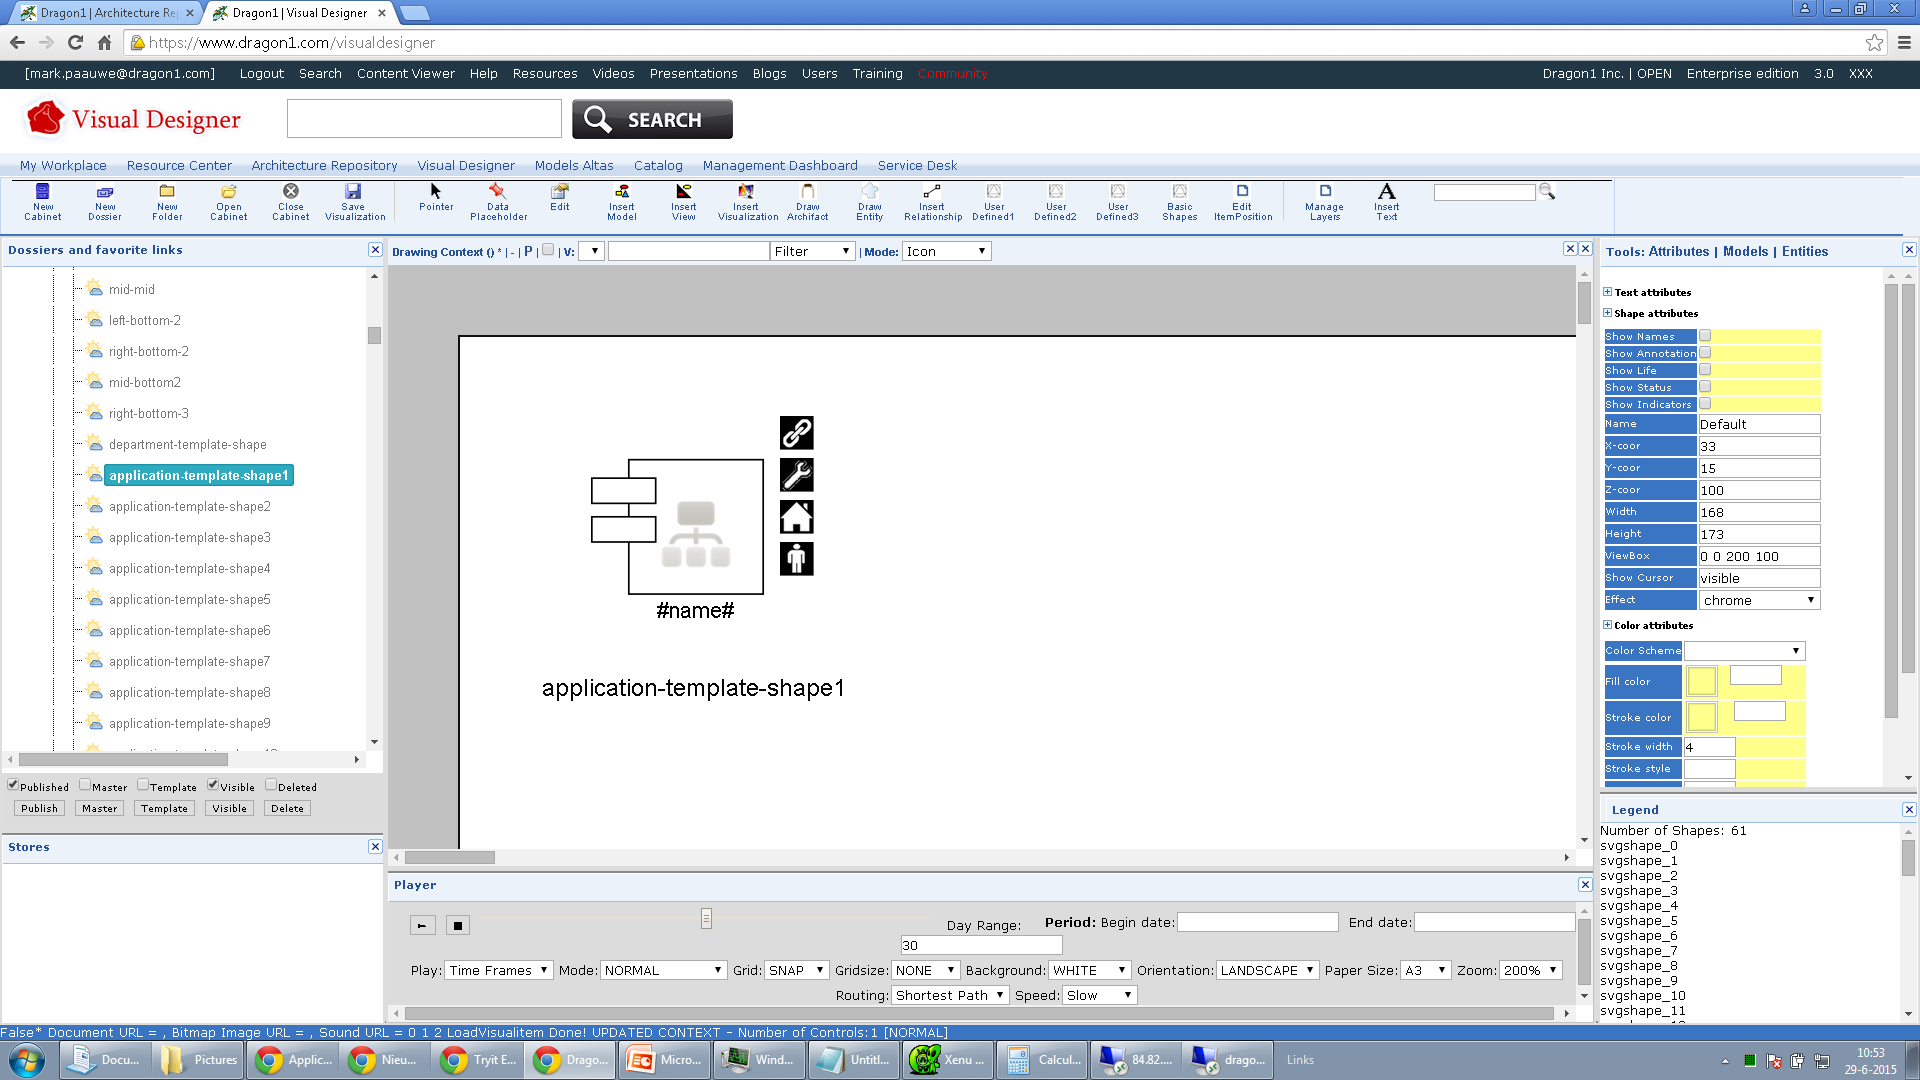
Screenshot of the Visual Designer showing a default available SVG Application Template Shape.
As seen in the Application Landscape snapshot figure below, applications have different colors. Some have a symbol inside them, and all have different color icons. Every icon tells a story about the status or value of an attribute of the application (like cost, ownership, etc...). This can also be a computed value.
In this example snapshot, you see some applications turn green (when they have no outstanding issues), the blue house icon means the application stores GEO data, the blue person icon means the application stores client data and the red colored wrench icon means service management data is unknown for this application. If the application has a department symbol inside, it is a mission-critical business application.
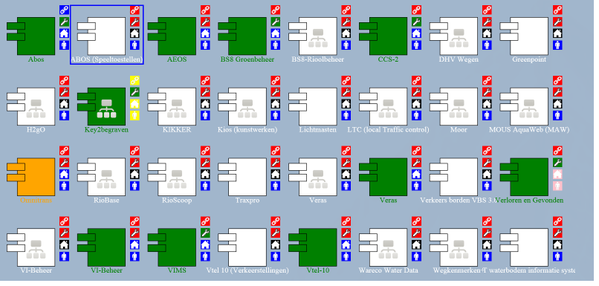
Snapshot of an application landscape using the default template application shape.
Now, this is a compelling way to give meaning to the status of the applications in your landscape: You can make decisions this way!
The icons, the inside symbols, and the colors are just examples of what you can do. You can design and choose whatever icons for application attributes you like and create your templated application shape.
Architecture Repository
Below you see the Architecture Repository web application of Dragon1 Innovation Lab with some applications entered as data. We will use this data to generate an application landscape. In the repository, the data is connected to an application model. And every application has certain attributes (like name, costs, ownership) filled in.
Enterprise architects usually work with EA Repository tools like this to store and relate all entities of an organization with each other. This EA Repository is unique because it's online and enables you to define meta-meta models to work with any approach, framework, or method, inside and outside the field of enterprise architecture.
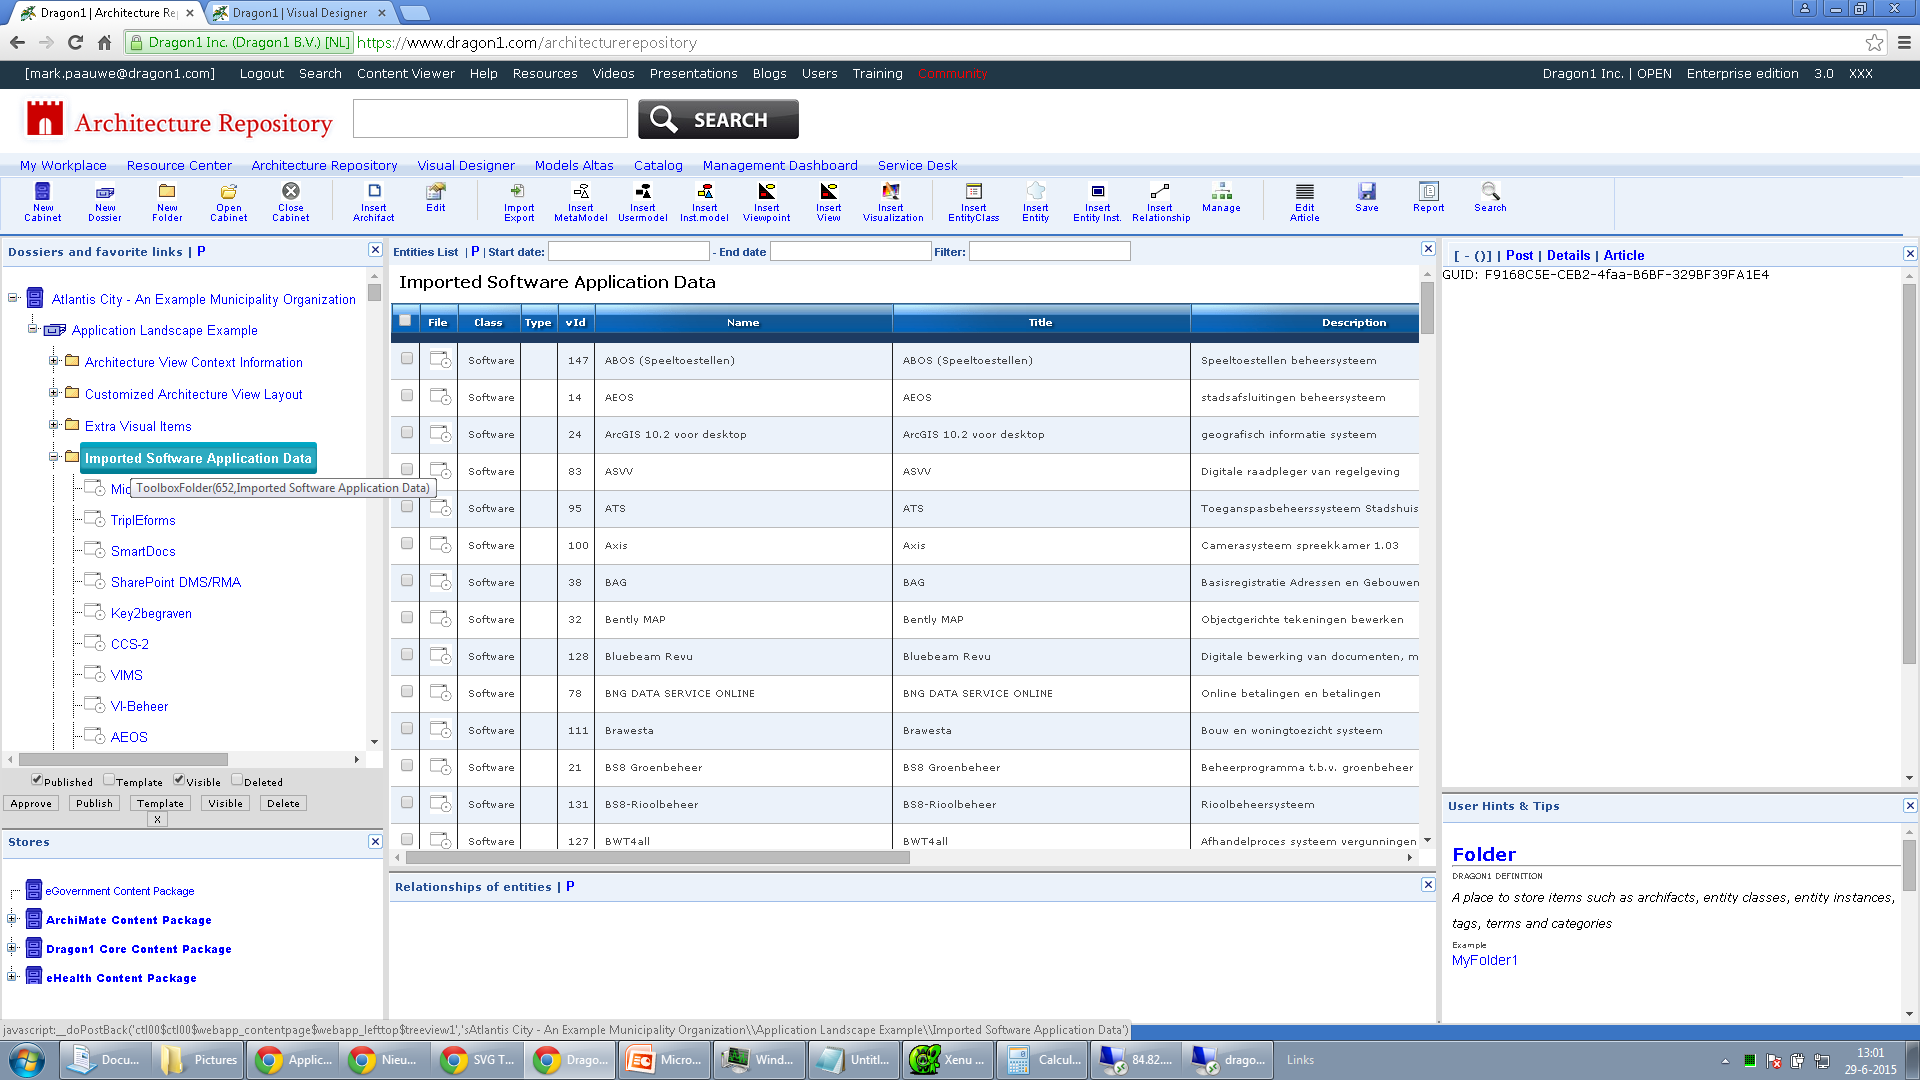
Screenshot of the Architecture Repository showing imported Software Application Data.
Visual Designer
In the Visual Designer, you can create and see models, views, viewpoints, and visualizations.
First, we show how a model with two applications connected to an organization could look based on the data imported or administrated manually in Dragon1 for the example organization:
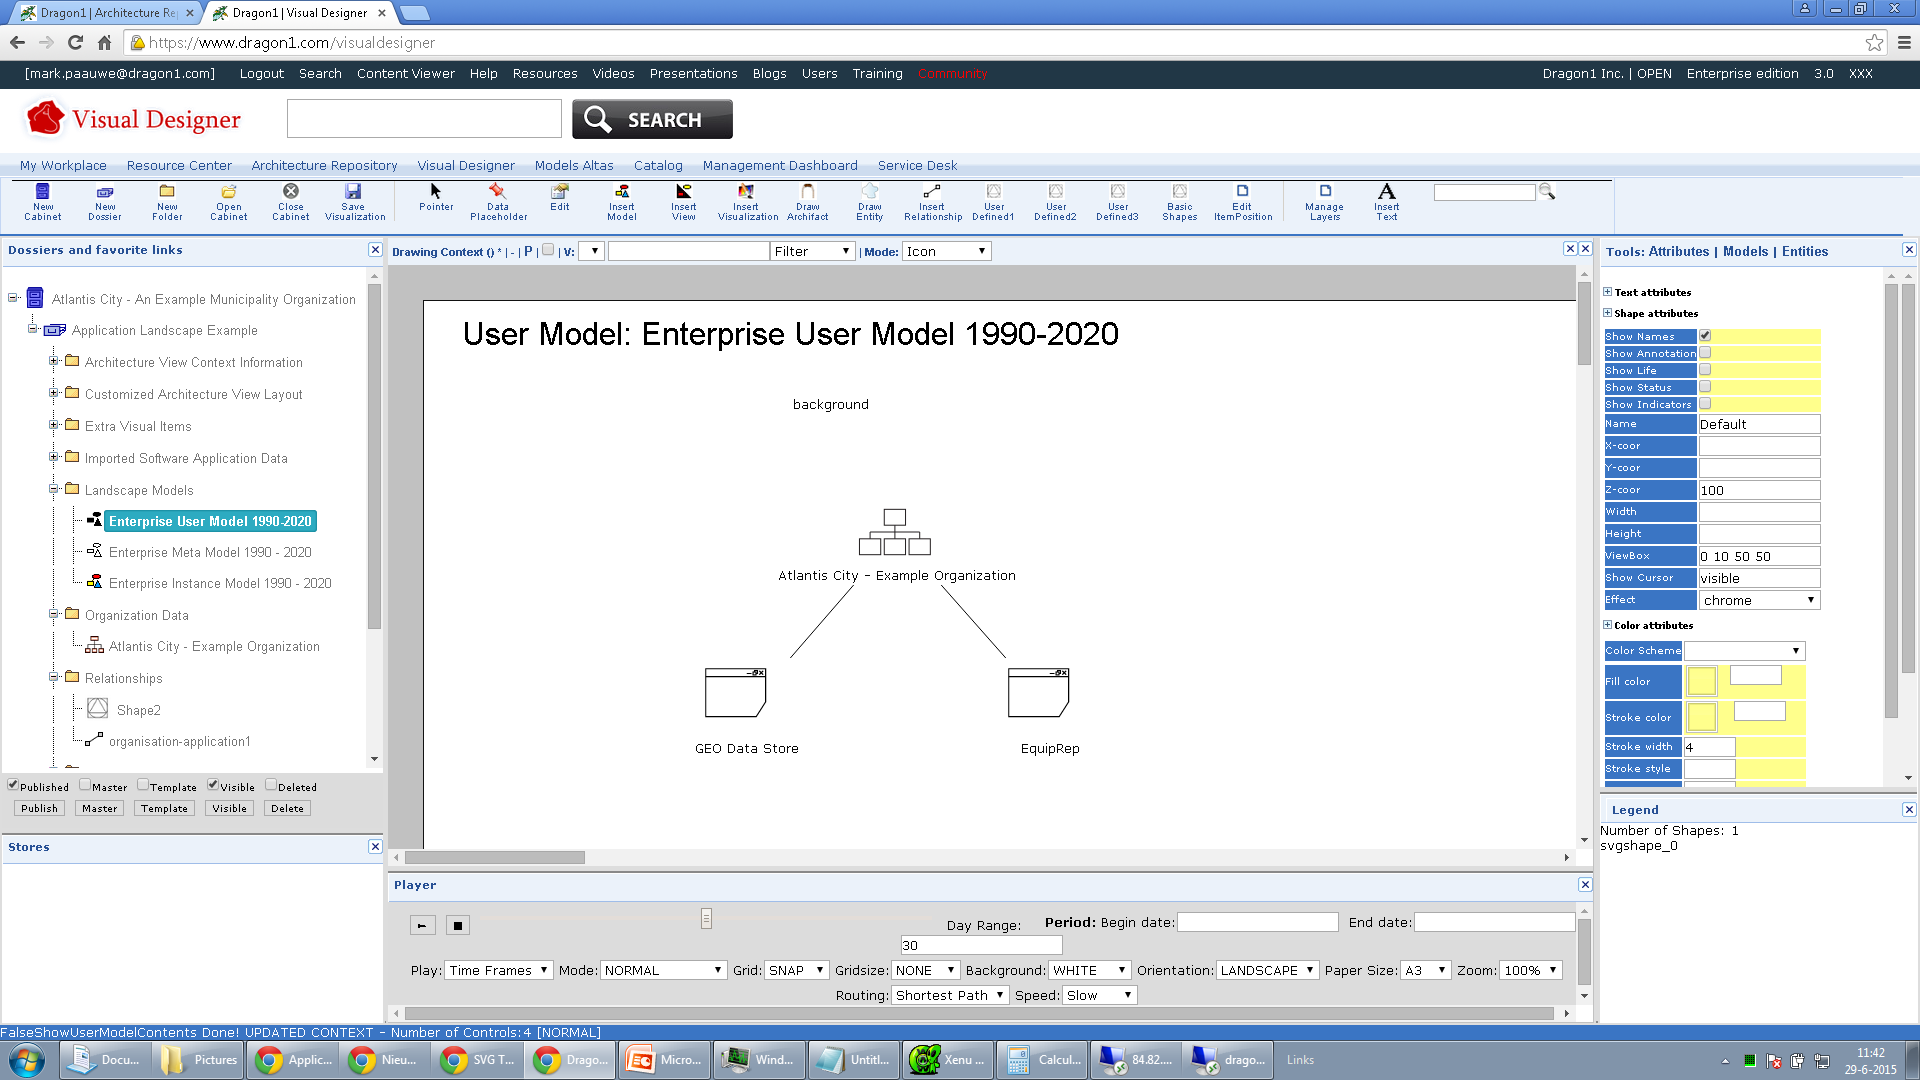
Screenshot of the Visual Designer showing a model based on the imported Software Application Data.
A model like this is not useful for making decisions. It only tells there is a certain relationship between entities. Nothing more. To have a visualization of data or a model that is meaningful to support decisions, we need shapes that interpret and visualize application attribute values. For that, we use the templated application shape.
Next, we show the view, a filtered model version. Only the entities, attributes, and relationships we want to show on the visualization must be let through. The rest of the data, in this case, the organization entity, is hidden/filtered out.
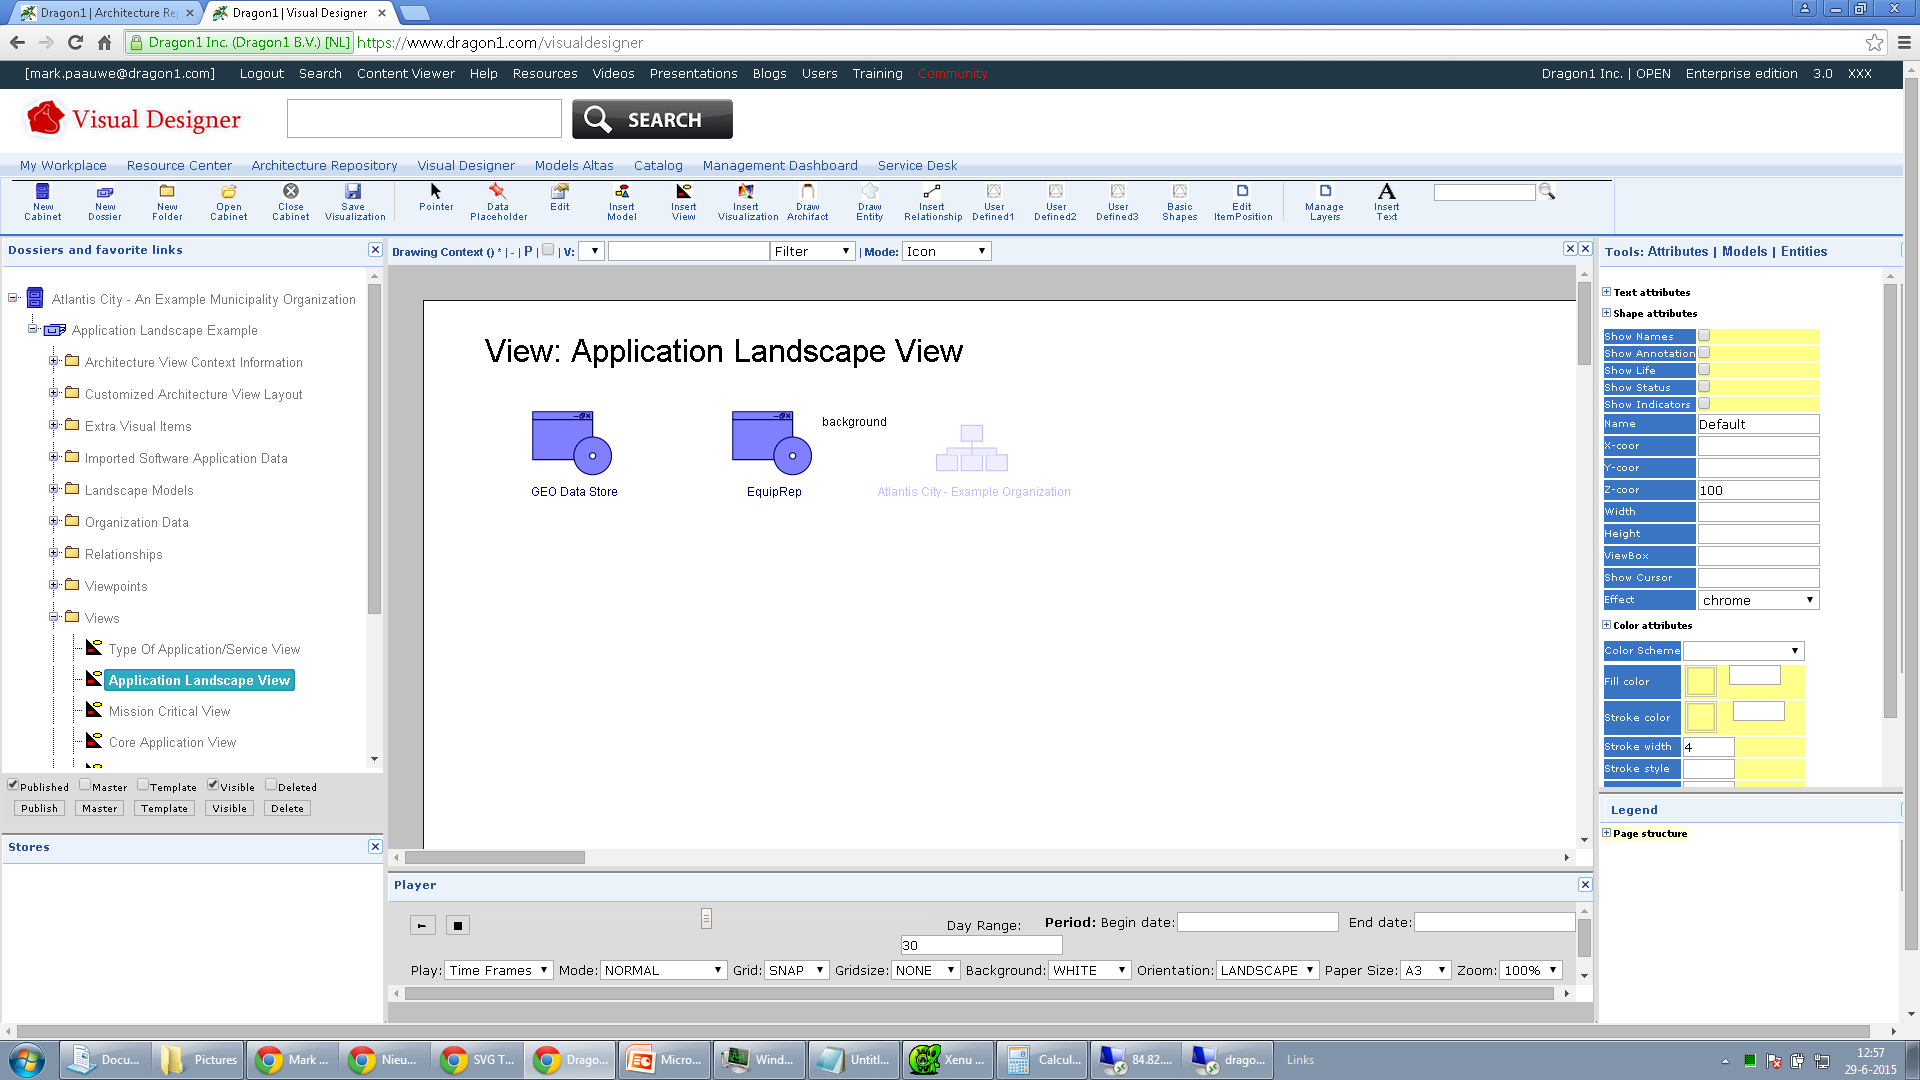
Screenshot of the Visual Designer showing a view of the model, filtering out the organization.
Below is a screenshot of the Visual Designer, which has generated the application landscape using the data from the repository. The landscape could also have been drawn completely by hand. However, generating a landscape saves a lot of time and is immediately updated when the data in the model changes.
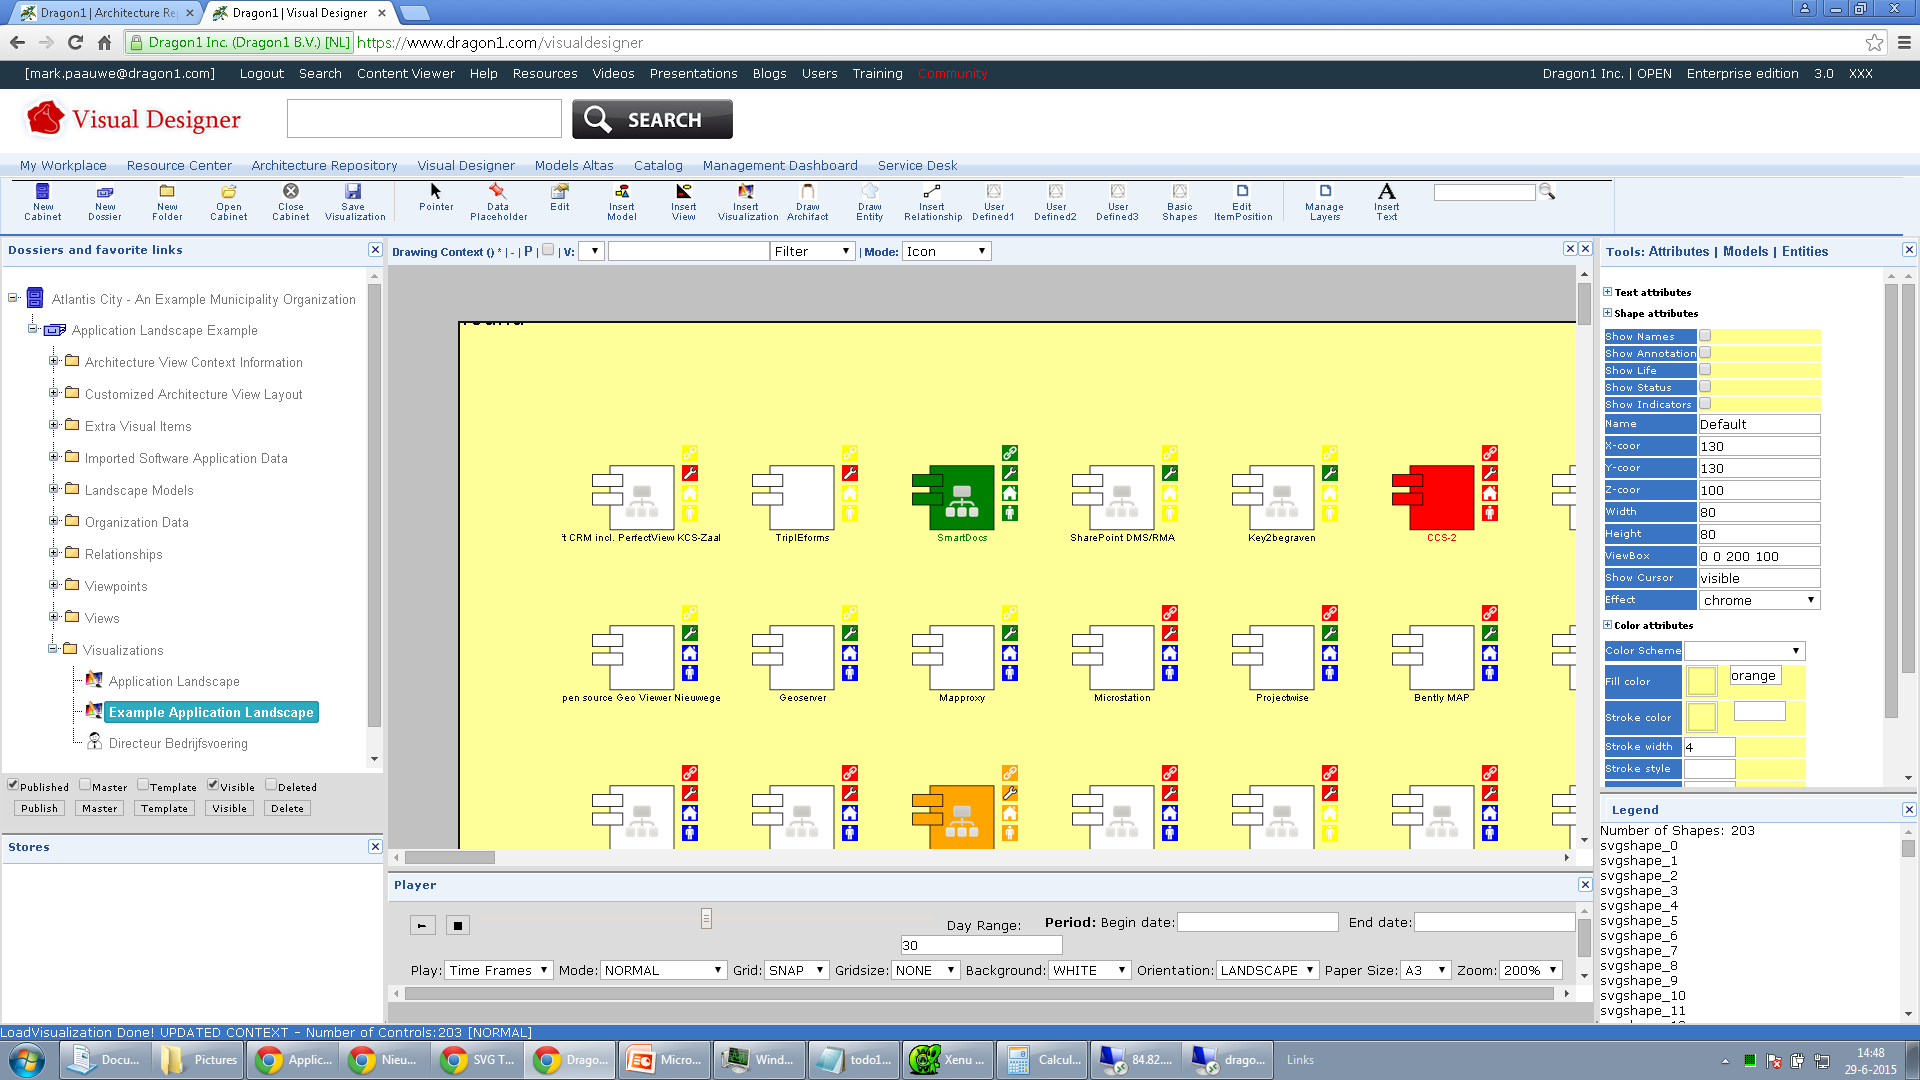
Screenshot of the Visual Designer showing a generated application landscape using the Templated Application Shape. This visualization is used to support decisions with.
More Information
If you want more information on the Dragon1 platform using it as an EA Tool to create or generate application landscapes like this, you can contact me directly via mark.paauwe@dragon1.com.
Read Also
If you liked this blog, you might also be interested in reading: