Projects are still hard to manage
Every organization deals with projects. Often, approaches like PRINCE2 and software like MS Project are used to gain control over projects. But this is not sufficient.
So, from my experience doing project management, I noticed that visualizations of the project were missing. I was surprised that there was no consensus or common view of the project structure within the steering group committee or the project team. Of course, you have auditors, but they often do not signal what has to be repaired in the project structure. Also, many project managers, due to time and budget constraints, were unable to resolve the issue with the project structure.
Why create a visualization of the Project itself?
With a visualization of the project, you can measure, check, evaluate, and change its structure. You can organize the correct environment for the project to excel. You can build the structure correctly. Make sure everything is in place. With an overview visualization of the project, it is much easier to communicate that everything is in place than with the project plan in text only.
With an overview visualization of the structure of the project, you can create a common view of the structure and make it a supported one.
My suggestion is that the owner/client has to demand a steering group that they have an updated Project Landscape Map for every project, and that they will report on it monthly. The project landscape maps must be filed for permanent access and to ensure survival through organizational changes. And this way of working has to be made part of the organization's quality system.
What to draw on a visualization of a Project?
Suppose the owner/client asks a steering group to report to him monthly with a visualization only of the progress of projects. Then, the steering committee is puzzled about what to draw from it.
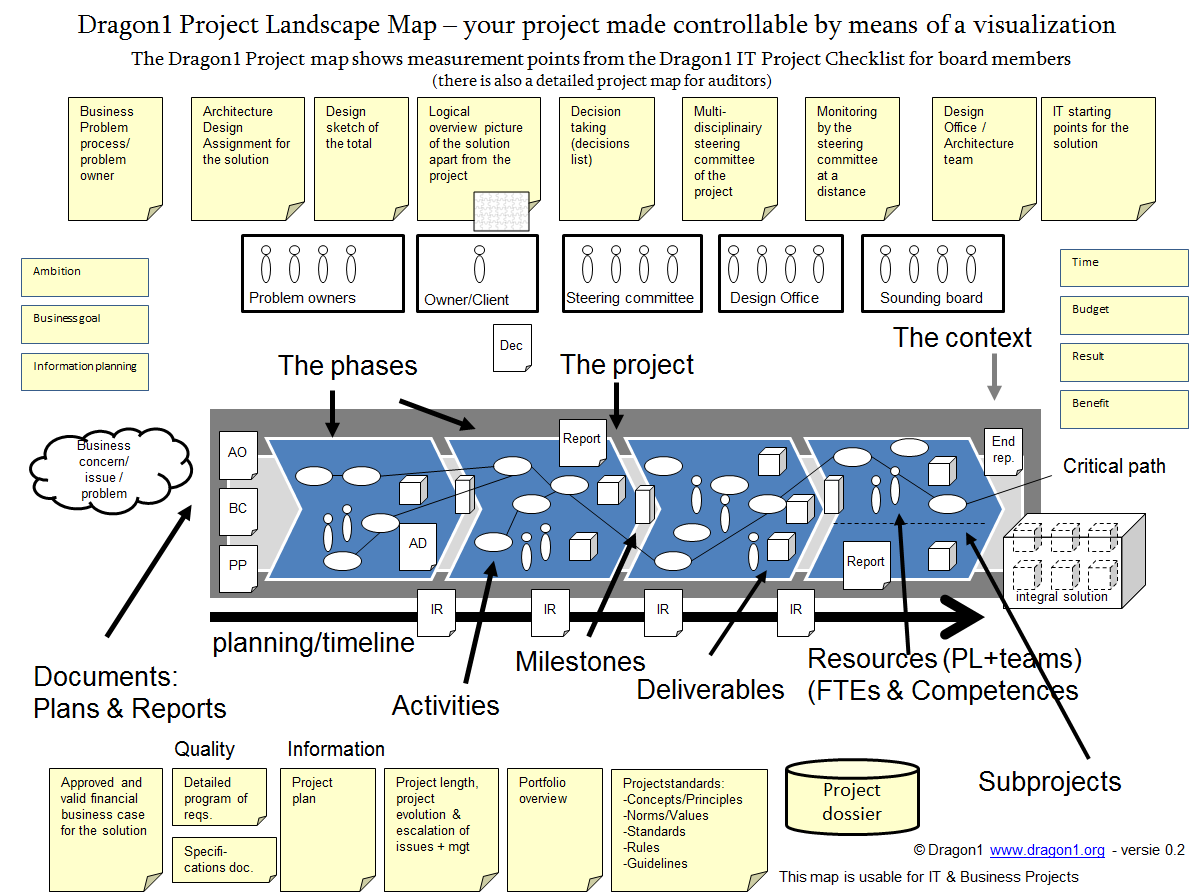
Dragon1 EA Method has a generic Project Landscape Map. It is an example of how you can create a project landscape map. You could even call this a project framework. This general visualization illustrates the key project controls (points on which a project can be measured and improved) for the owner/client and steering group members of a project.
Why these controls? These are the controls that the Dragon1 EA Method addresses as important. Various project methods often use controls. So, it is easy for you to adjust this Dragon1 Project Landscape Map to your situation, so you already have a lot of known controls. You only have to adjust the controls you already use in your project management approach.
Also, you can look at what auditors see when auditing a project. You can also add these controls to your visualization.

Visualization Project Landscape Map.
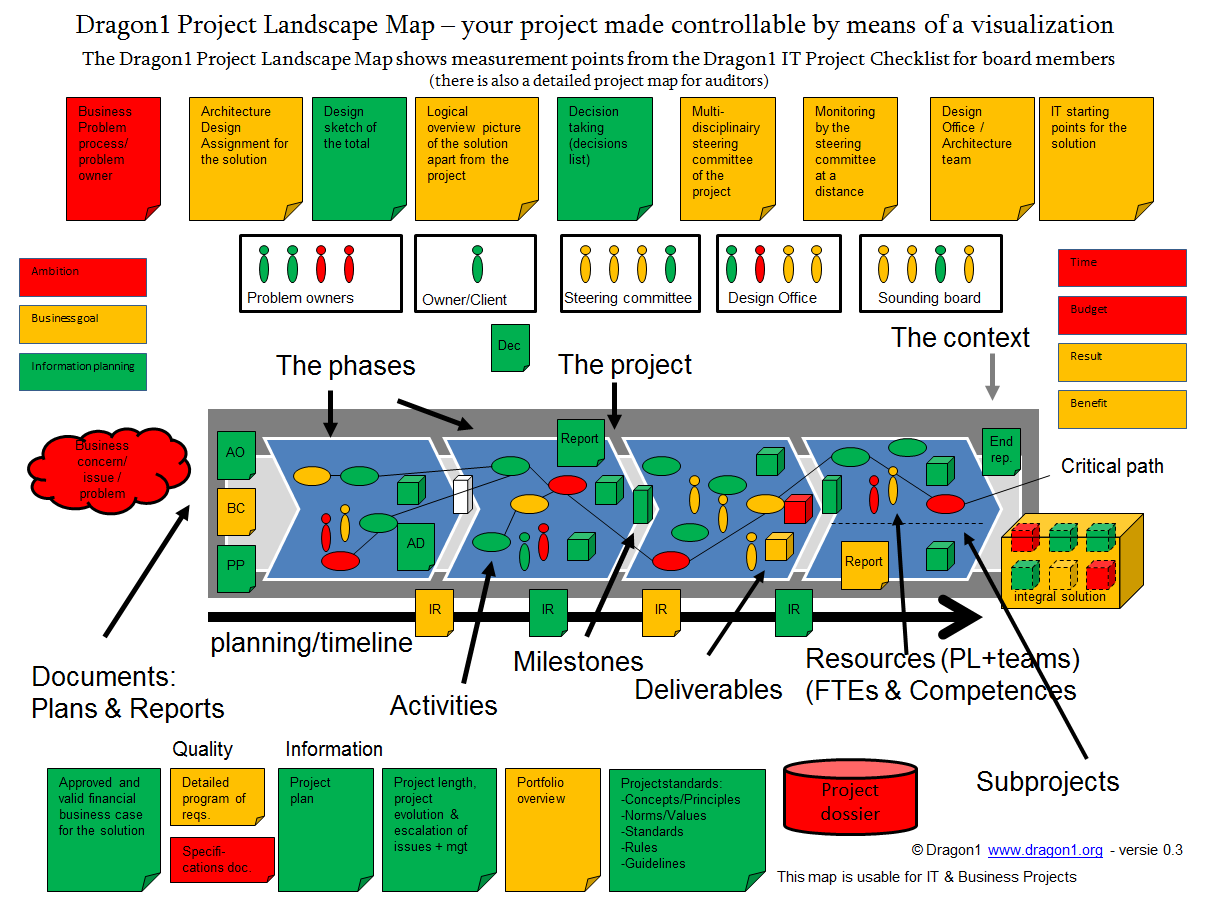
Why is that rectangle colored red?
This example of the project landscape map is still a neutral visualization. It only shows what should be in place for a certain type of project. However, this does not yet reveal what is in place for a specific project at a particular moment. For that, we need to chart our project on this map.
In the following visualization, it becomes clear what impact it has when colorizing the controls, communicating their status or progress. With this reported information the owner/client can start asking the steering committee: “Why is that rectangle called 'budget' colored red and what impact does that have on that cube called 'integral solution'?And for us architects, that’s all we want to achieve with visualizations. Isn’t it? These visualizations are used for supporting decision-making.

Decision-Making Visualization Project Landscape Map.
Dragon1 Checklist for IT Projects
In the Dragon1 EA Method, all the important project controls that make up part of the project structure are listed in a checklist available for download on the Dragon1 Platform. The checklists have been divided into concise versions for board / top management, project managers, and auditors.
Here is a link to the short checklist for IT projects (Board member version):
https://www.dragon1.com/downloads/dragon1-checklist-IT-project-auditing-basic-OS05-PC009-EN_v1.0d.doc
Here is a link to the detailed checklist for IT projects (Auditors version):
https://www.dragon1.com/downloads/dragon1-checklist-IT-project-auditing-detail-OS05-PC009-EN_v1.2d.doc
Other visualizations, like a deliverable / work breakdown structure, are recognized in Dragon1. I will post a blog on that one shortly.
I am very interested to learn about your experiences charting your project on a landscape map. Please post them, for example, in the LinkedIn Dragon1 Usergroup | Visual Enterprise Method. So we can use your experience to improve the Dragon1 EA Method.